
Figure 8.
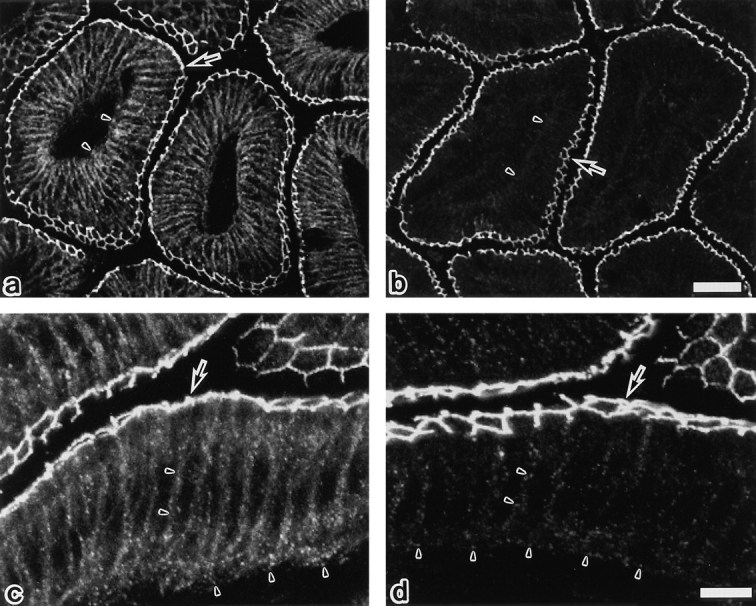
Confocal immunofluorescence microscopy of frozen sections of chick intestinal epithelial cells with anti–chicken occludin mAb, Oc-2 (a and c), or Oc-3 (b and d). Oc-2 stained both the junctional complex regions (arrows) and the basolateral membrane domains (arrowheads) in linear and dotted manners, respectively. By contrast, Oc-3 mainly stained the tight junction region (arrows), showing a very weak signal only from the basolateral membranes (arrowheads). In our previous study (Furuse et al., 1993) it was emphasized that Oc-2 is specific for tight junctions without paying special attention to its staining at the basolateral membrane domains, but as shown here, the difference in the staining pattern is significant between Oc-2 and -3. Bars: (a and b) 30 μm; (c and d) 10 μm.