
Figure 3.

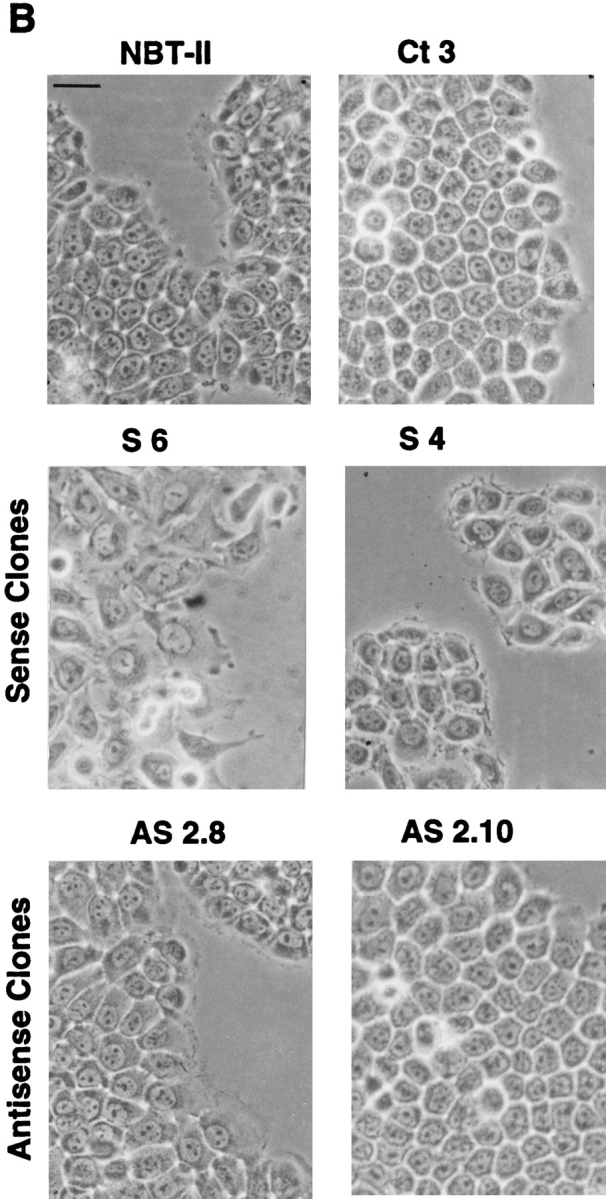
slug-transfected cells display a modified morphological phenotype. After selection and cloning, stable transfectant clones were cultured under standard conditions. (A) Phenotype expression of stable slug transfectants, comparing sense, antisense, and control clones. 37 clones were analyzed by phase-contrast microscopy for their phenotype and classified according to the appearance of cell–cell junctions as tight, intermediate, and loose. (B) Phase-contrast micrographs of sense (S6 and S4) and antisense (AS2.8 and AS2.10) slug transfectants were taken after 48–72 h of cell culture. The morphology of the cell junctions in S4 and S6 were classified as loose, whereas the other four were classified as tight for quantification for A. Bar, 10 μm.