
Figure 6.
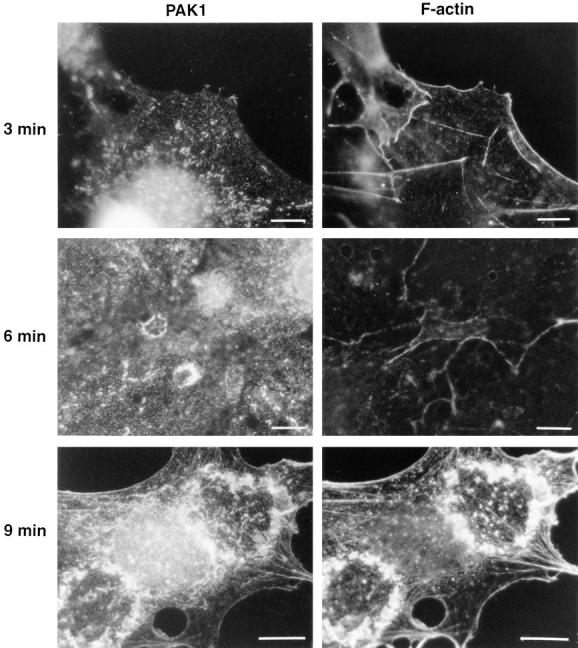
Time course of PAK1 and F-actin localization after PDGF stimulation. (Left column) Cells stained with affinity-purified anti-Pak1 antibody; (right column) cells stained with rhodamine-phalloidin. Cells were fixed at 3, 6, and 9 min after stimulation with PDGF, as described in Materials and Methods. Bars, 15 μm.