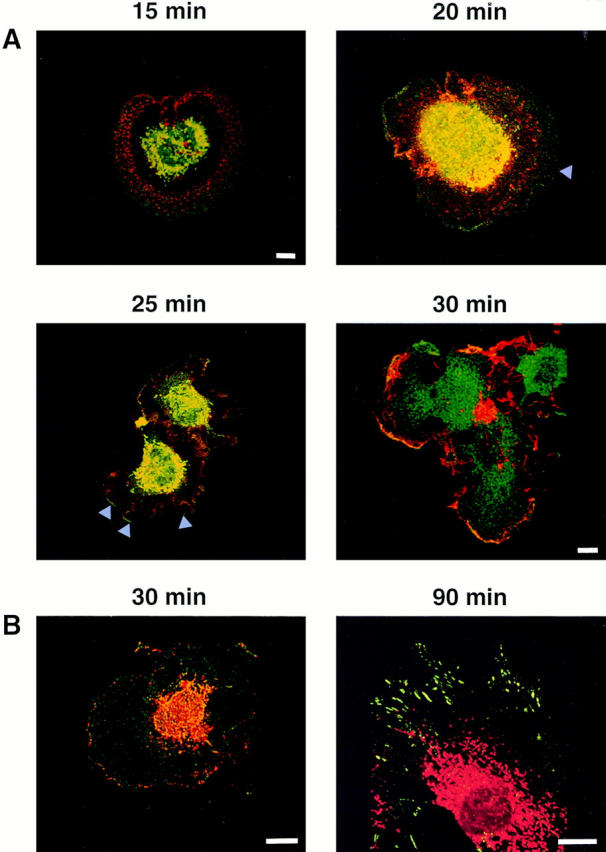
Figure 8.

Distribution of PAK1 and F-actin in Swiss 3T3 cells plated on fibronectin. (A) PAK1 and F-actin distribution after stimulation with PDGF and plating on a fibronectin matrix. Confocal micrographs of quiescent Swiss 3T3 cells at 15, 20, 25, and 30 min after stimulation are shown. Red, Rhodamine-phalloidin staining of F-actin; green, fluorescein staining of PAK1; yellow, merged images indicating the areas of colocalization. (B) PAK1 and phosphotyrosine localization after PDGF stimulation when plated on fibronectin. Confocal micrographs of Swiss 3T3 cells at 30 and 90 min after stimulation are shown. (30 min) Red, Rhodamine staining of phosphotyrosine; green, fluorescein staining of PAK1; yellow, merged images indicating the areas of colocalization. (90 min) Red, rhodamine staining of PAK1: green, fluorescein staining of phosphotyrosine. Bars, 15 μm.
