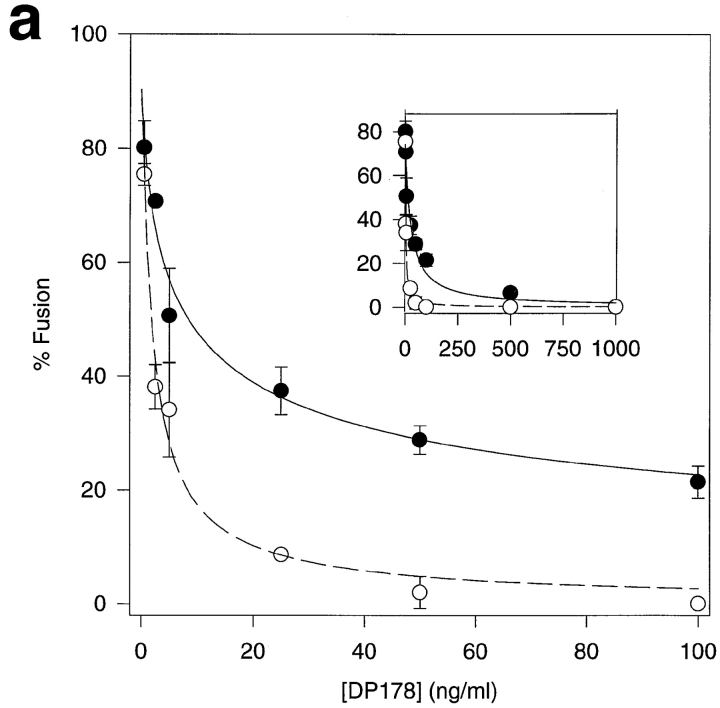
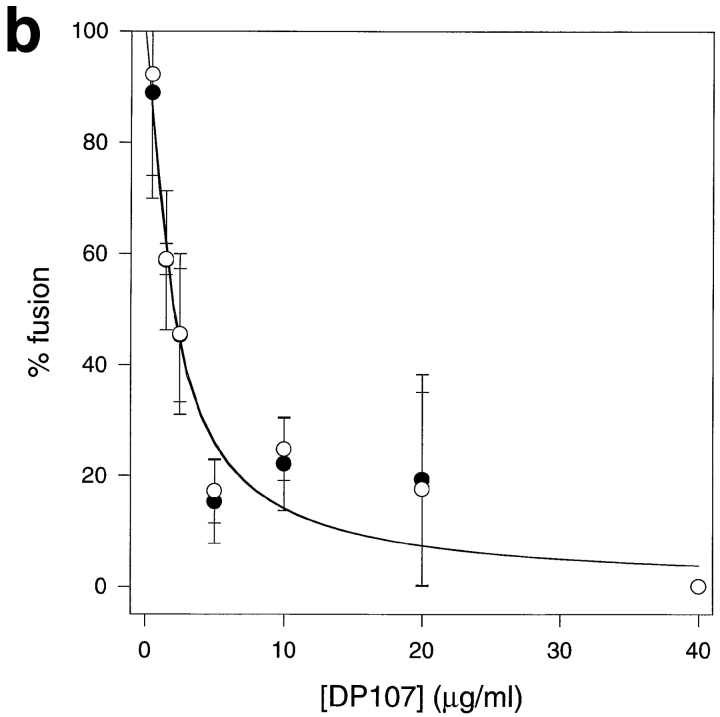
Figure 3.
Comparison of lipid mixing versus cytoplasmic mixing. TF228 cells were labeled with the cytosolic probe CMAC, and SupT1 with both the lipophilic probe DiI and the cytosolic dye calcein. After 2 h of incubation at 37°C, cells positive for the three dyes were scored as positive for cytoplasm mixing, and cells positive for DiI and CMAC as positive for lipid mixing only. The percentage of cell–cell fusion in both cases is relative to the control without peptide. For every sample, three different fields were acquired. Data are the mean ± SD of two or three independent experiments. •, lipid mixing; ○, cytoplasm mixing. (a) Plot for DP178. Solid line, curve-fit to the lipid mixing data according to Eq. 1 with ε = 1.35 and K I = 14.4 ng/ml; dashed line, curve-fit to the cytoplasm mixing data according to Eq. 1 with ε = 2.06 and K I = 0.96 ng/ml. Inset, same plot for DP178 at concentrations up to 1,000 ng/ml. (b) Plot for DP107. Solid line, curve-fit to the lipid and aqueous mixing data according to Eq. 1 with ε = 8.5 and K I = 185 ng/ml.


