
Figure 3.
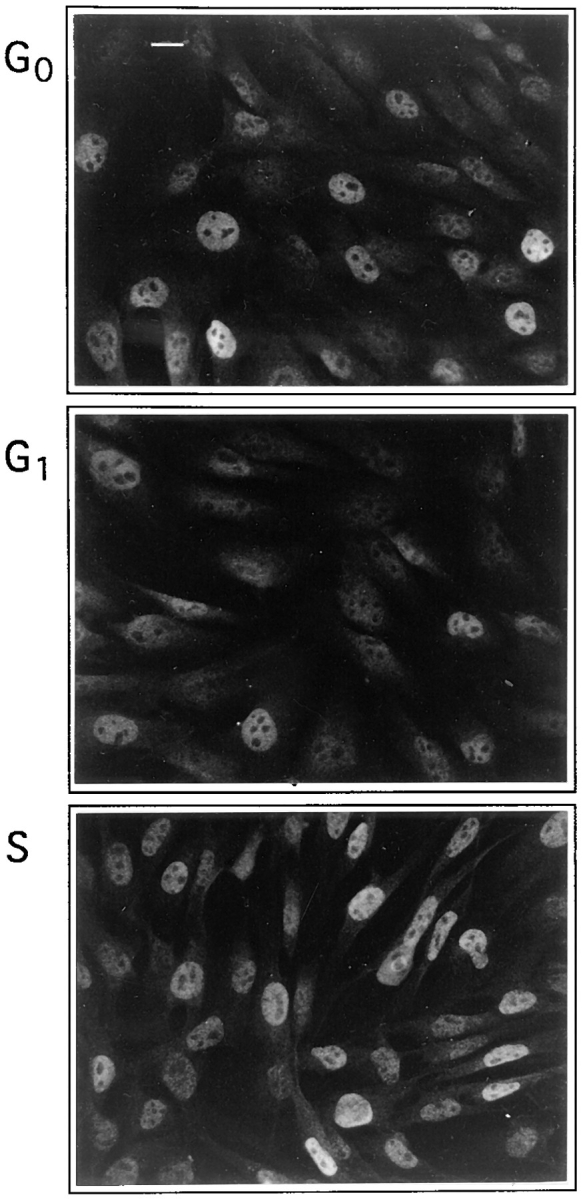
Myf5 expression varies with the cell cycle. Anti-IGFII C2 cells were synchronized by growth in 0.5% serum for 24 h (G0, top) followed by 6 h stimulation in 20% serum in the presence of 2 μg/ml aphidicolin (G1, center) followed by removal of aphidicolin for 6 h (S, bottom). Cells were fixed and stained for Myf5 expression. The designation of cell cycle phases in this figure is justified in Fig. 4 A. Bar, 10 μm.