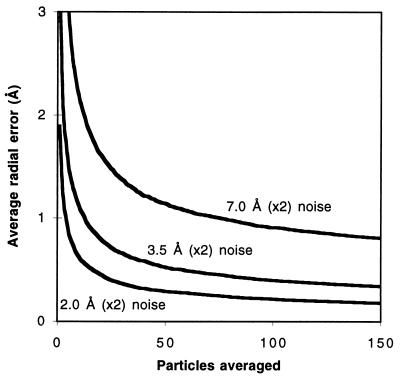
Figure 1.
Accuracy of original cluster coordinate determination. The average radial error in a cluster position is shown for differing levels of noise after results from n particles are averaged. The three curves represent simulations in which projected coordinates are randomly displaced by the given amount of noise twice: once to model the cluster’s movement with respect to the particle, and again to model error in locating the cluster’s center in the micrograph. Each curve is the average error after n particles for 500 different iterations of the procedure, each beginning with a unique, randomly generated cluster configuration.

