
Figure 5.
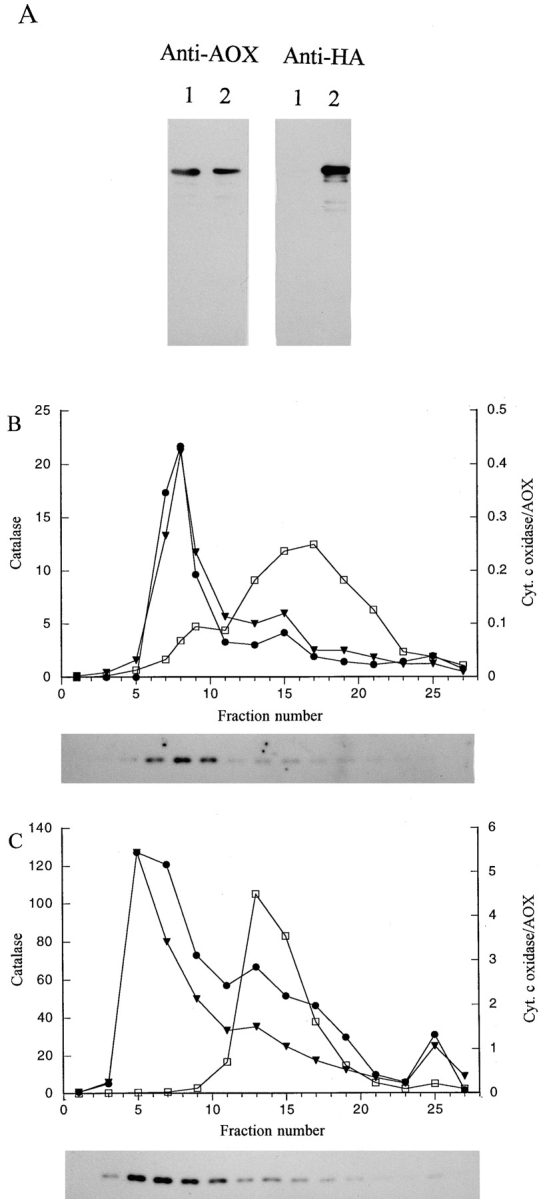
Sucrose density gradient analysis of P. pastoris strains expressing AOX–HA. (A) Total cell extracts (10 μg/lane) prepared from a strain expressing only AOX-WT (lane 1) or AOX-HA (lane 2) and immunoblotted with antibodies against AOX and the HA tag. Sucrose density gradient profiles of strain MC-HWO42 expressing only AOX–HA (B) or strain GS–HWO42 coexpressing both AOX–HA and AOX-WT (C). Symbols in the gradients are: AOX (•), catalase (▾), and cyt c oxidase (□). In B, catalase activities are presented as ΔE240 U/ml, cytochrome c oxidase activities as U/ml, and alcohol oxidase activities as U/ml × 10−2. In C, catalase activities are presented as ΔE240 U/ml, cytochrome c oxidase activities as U/ml, and alcohol oxidase activities as U/ml × 10−1. The immunoblots shown below each graph contained either 5 (B) or 1 μl (C) of each indicated fraction and were reacted with anti-HA monoclonal antibodies.