Figure 12.
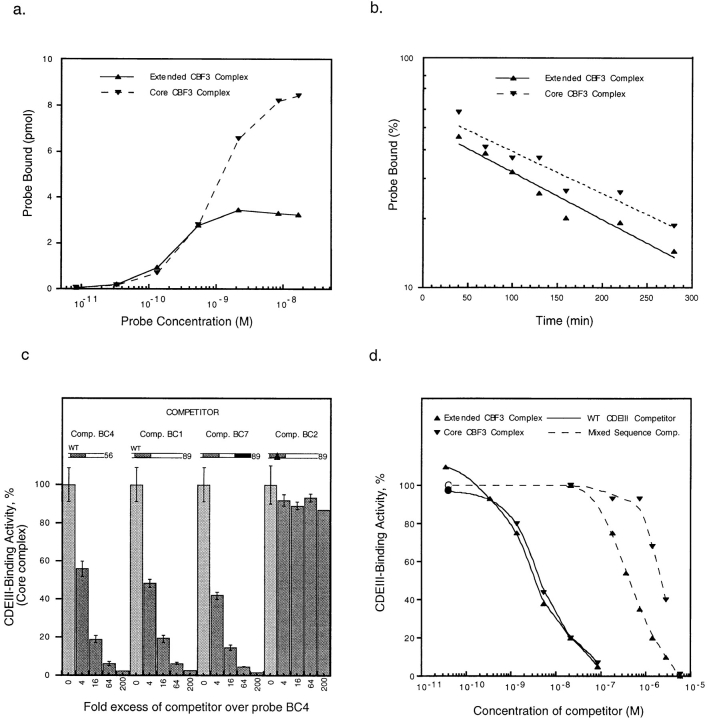
Analysis of core and extended CBF3 complexes. (a) Data for the saturation curve was obtained by adding an 89-bp wild-type probe (probe BC1) at increasing concentrations to a fixed amount of semi-pure yeast CBF3 and then determining the amounts of core and extended complexes on bandshift gels. (b) The off-rate for yeast CBF3 DNA complexes was measured by adding 200-fold excess of unlabeled BC1 competitor to CBF3 prebound to a radiolabeled 89 bp wild-type probe (BC1). At time points between 5 and 270 min, reactions were loaded on bandshift gels for analysis. Data points and best-fit exponential lines are shown. The lines extrapolate back to 100% binding at −90 min. This was the running time of the gel, suggesting that CBF3 was equilibrating between labeled and unlabeled CDEIII DNA throughout this period. (c) rCBF3 and radiolabeled probe BC4 were mixed with a 4- to 200-fold excess of unlabeled centromeric DNA competitors (as indicated) and analyzed on bandshift gels (see Fig. 6). (d) 89-bp radiolabeled CEN3 DNA (probe BC1) was mixed with unlabeled 89-bp wild-type CDEIII DNA (solid lines) or sheared salmon sperm testes DNA (broken lines) at a range of concentrations and rCBF3 was then added. Values are expressed as a percentage of CDEIII binding observed in the absence of competitor. Upper (more slowly migrating) and lower (more rapidly migrating) complexes are indicated by right-side-up and inverted triangles, respectively.

