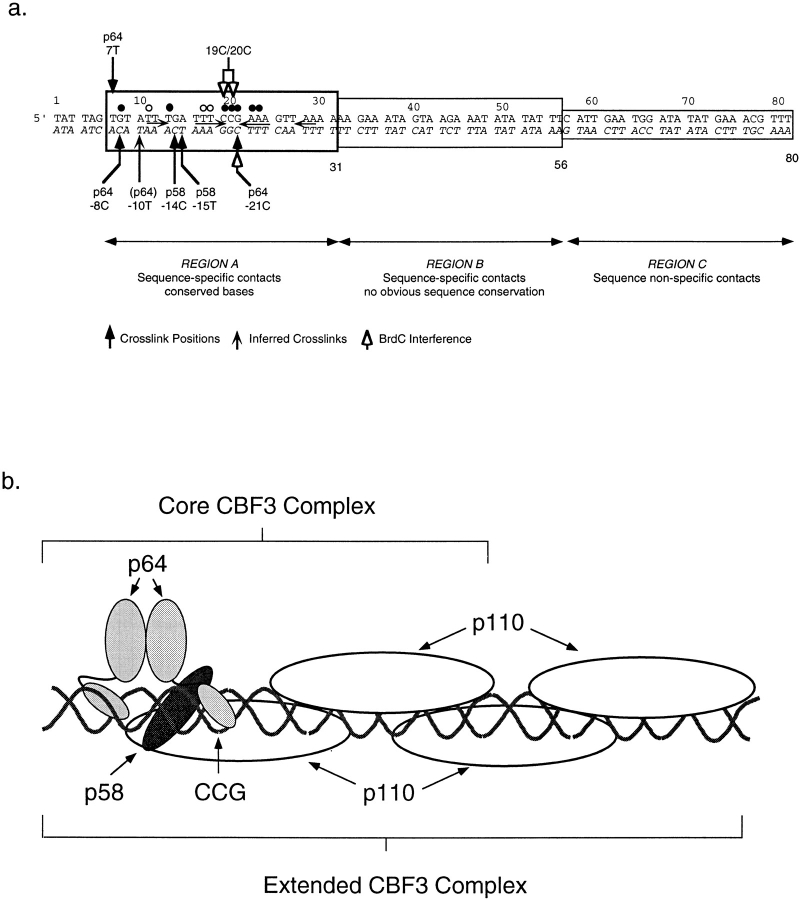
Figure 14.
A model for the organization of the CBF3–DNA complex. (a) The positions of BrdU- and BrdC-mediated crosslinks (solid arrows) and BrdC-dependent interference of the CBF3–DNA interaction (open arrows) are shown in the diagram. Sequences with which CBF3 makes sequence-specific and -nonspecific contacts are indicated. (b) CBF3 subunits have been positioned at their sites of DNA crosslinking and the core and extended CBF3 complexes indicated with brackets. See Results for details.

