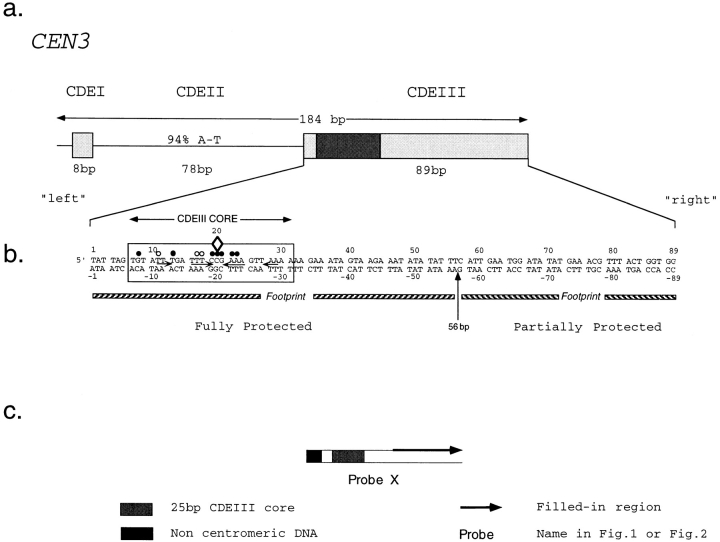
Figure 3.
Structure of CEN3 sequences used in this study. (a) Boxes indicate CDEI and CDEIII sequences. (b) The boxed bases denote the conserved core of CDEIII as determined by Hegemann et al. (1988). A diamond marks the location of the essential CCG motif. Solid circles indicate bases conserved among all 16 S. cerevisiae centromeres. Open circles indicate bases conserved in 15 of 16 centromeres. The top strand of DNA is numbered from 1 to 89 and the corresponding bottom strand is numbered from −1 to −89. “Left” refers to bases that are CDEII proximal, and “right” refers to the bases that are centromere distal. (c) This schematic is used in subsequent figures to represent various crosslinking probes. The heavy arrow indicates the region of single-stranded DNA in which BrdC or BrdU, 32PαdATP and native bases were incorporated by enzymatic fill-in.

