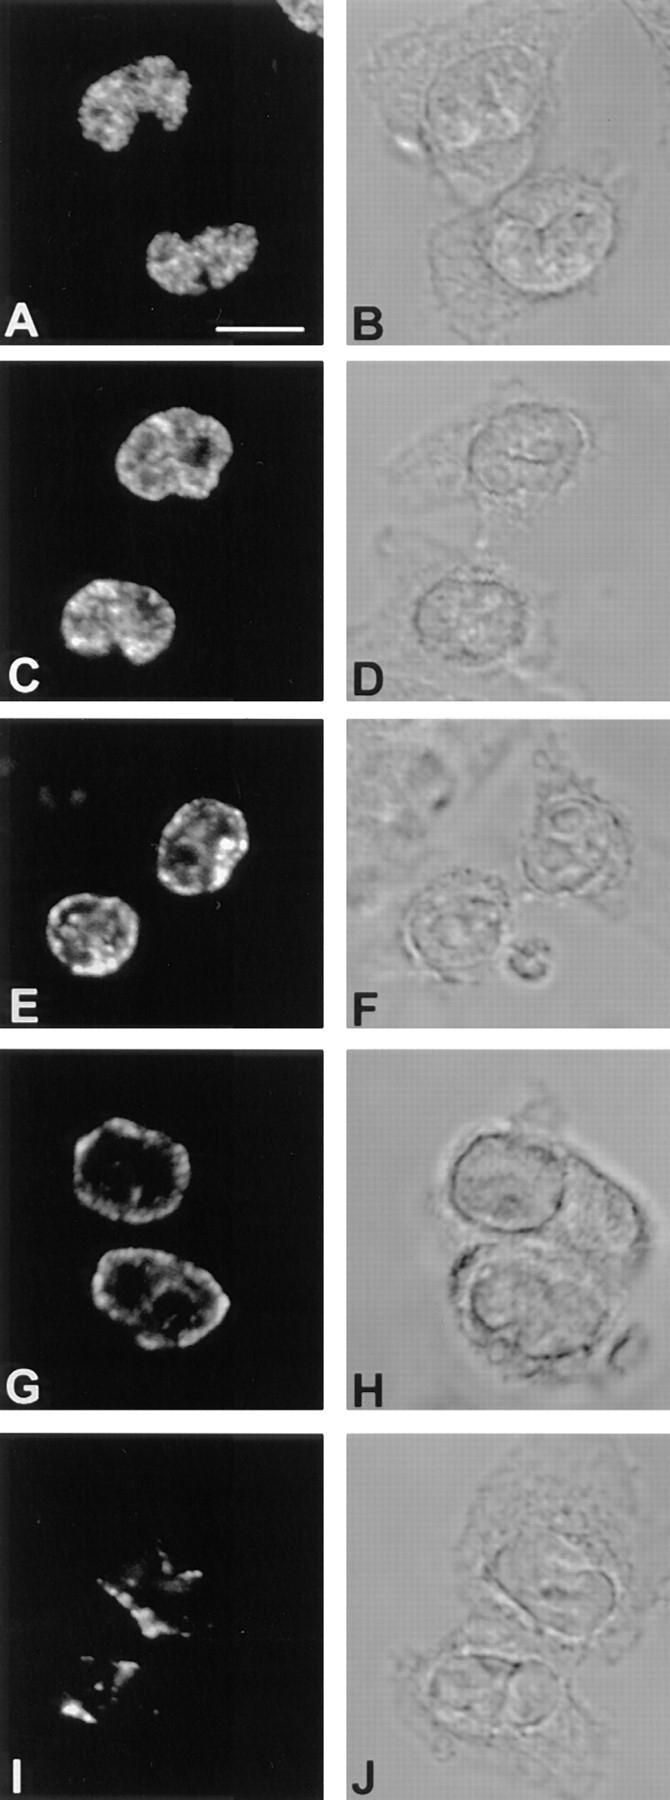
Figure 12.

Late telophase/early G1 cells display spatial configurations of BrdU-DNA similar to the replication patterns seen during S phase. Confocal images are shown for cells harvested during the peak of each pattern (refer to Fig. 11). (A) Pattern 1; (C) pattern 2; (E) pattern 3; (G) pattern 4; (I) pattern 5. The corresponding phase contrast images are depicted in the right column (B, D, F, H and J). Bar, 10 μm.
