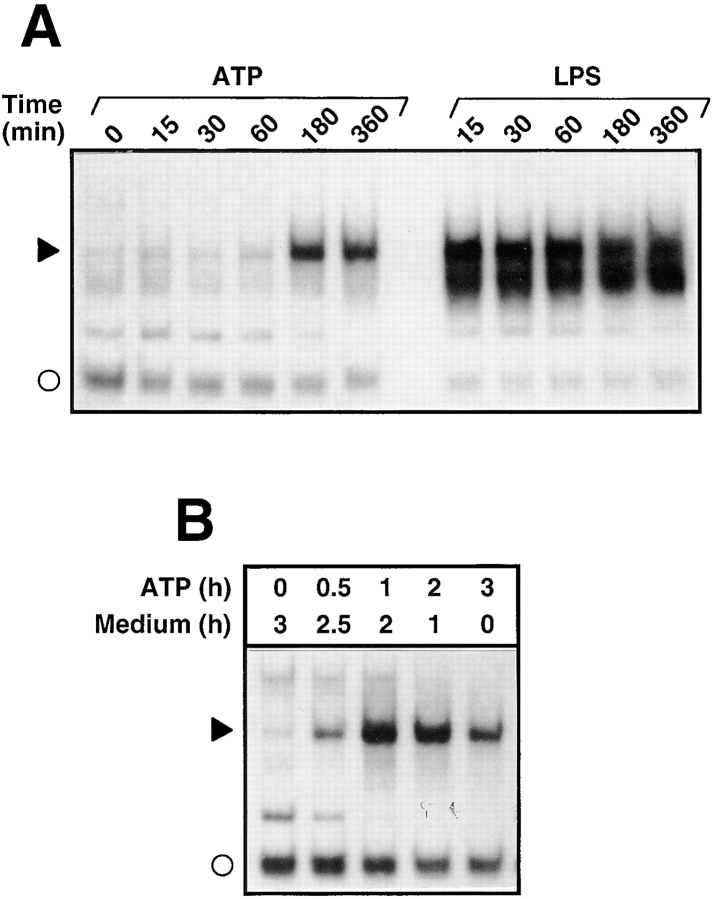
Figure 2.
Time dependence of NF-κB activation in response to ATP and LPS. (A) Kinetics of NF-κB activation: total extracts of cells treated for the indicated periods of time with 3 mM ATP or 100 ng/ml LPS were prepared and analyzed by EMSA. Only a section of the autoradiogram is shown. The filled arrowhead indicates the position of the inducible NF-κB–DNA complex; the open circle denotes a non-specific complex. (B) Pulse-chase experiment: N9 cells were stimulated for different times (0.5–3 h) with 3 mM ATP and further incubated for the indicated time periods in culture medium without ATP. After a total incubation time of 3 h, cells were harvested and analyzed for NF-κB DNA-binding activity.

