Figure 6.
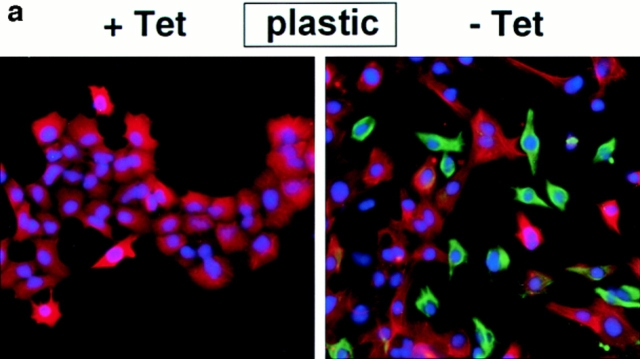
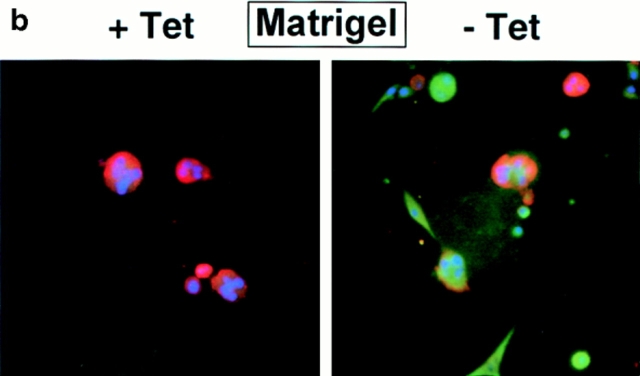
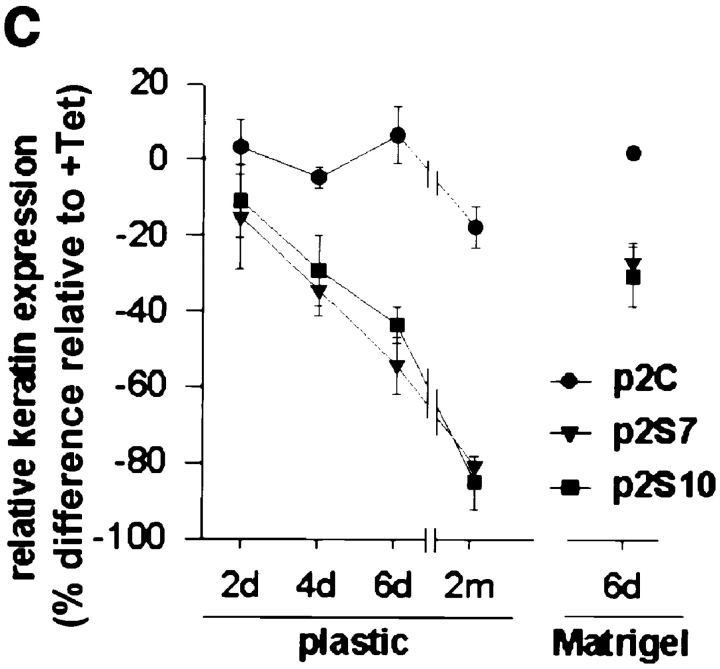
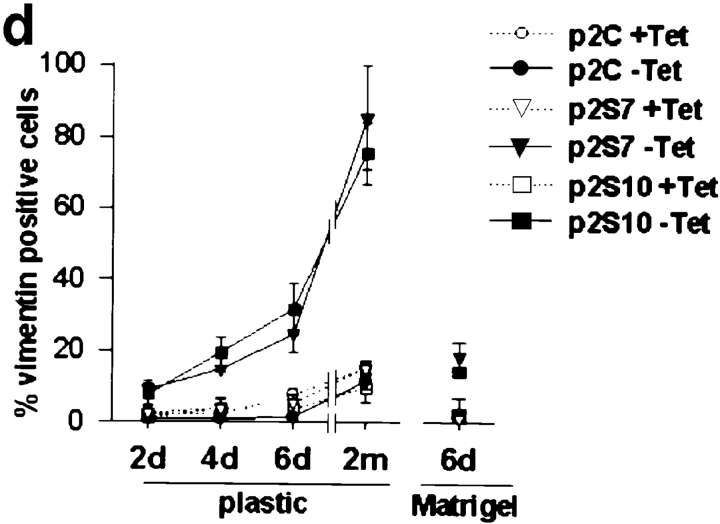
Effect of SL-1 induction on cytokeratin and vimentin expression. (a–b) P2S10 cells were maintained for 6 d in the absence (a) or presence (b) of Matrigel and in the presence (+ Tet) or absence (− Tet) of Tet. Cells were analyzed by indirect immunofluorescence for expression of cytokeratins (red) and vimentin (green). Cells were counterstained with DAPI (blue) to visualize nuclei. Note that in the presence of Matrigel most cells are round and form multicellular aggregates. (c) Quantification of cytokeratin expression by ELISA on p2C (•), p2S7 (▾), and p2S10 (▪) cells maintained on plastic and induced to express SL-1 for 2, 4, and 6 d (2d, 4d, and 6d), or 2 mo (2m), or on cells maintained in the presence of Matrigel for 6 d. Results are expressed as the percent increase or decrease in cytokeratin expression of cells maintained in the absence of Tet as compared to cells maintained in the presence of Tet. Means and standard deviations from three independent experiments are shown. (d) Quantification of the number of vimentin expressing p2C (circles), p2S7 (triangles) and p2S10 (squares) cells maintained on plastic or in the presence of Matrigel, and induced (black symbols) or not induced (white symbols) to express SL-1 for the times indicated above. Results are expressed as the percentage of cells displaying vimentin immunoreactivity. Means and standard deviations from three independent experiments are shown.


