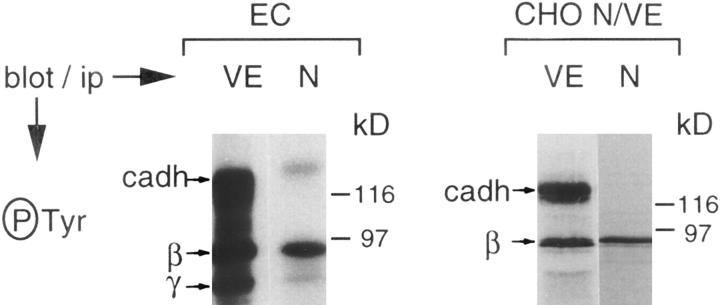
Figure 8.
Tyrosine phosphorylation analysis of cadherin–catenin complex in ECs and CHO N/VE cotransfected cells. Similar number of cells were immunoprecipitated with VE- or N-cadherin antibodies and blotted with an antibody against phosphotyrosine. The bands corresponding to the molecular weight of cadherin, β-catenin, and plakoglobin are indicated on the left. VE-cadherin phosphorylation level is much higher than that of N-cadherin. Molecular weight markers are indicated on the right.

