
Figure 5.
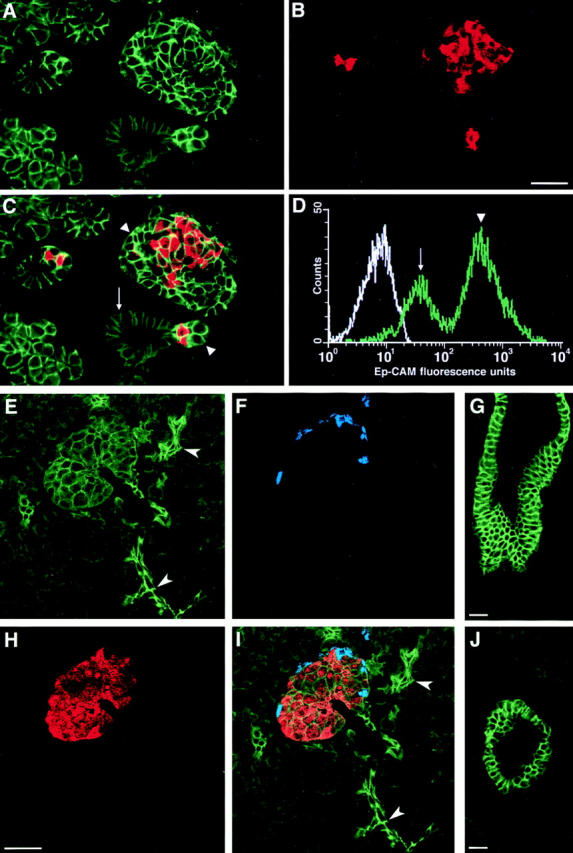
Developmentally regulated expression of Ep-CAM in the human pancreas. Confocal analysis performed on cryostat sections of a HFP, double immunostained for Ep-CAM (A) and insulin (B), reveals the upregulation of Ep-CAM expression in cell clusters budding from the ductal epithelium (A). The two fluorophore spectra are merged in C, where insulin-positive cells (red) are identified within clusters displaying the brightest immunoreactivity for Ep-CAM (green). D represents a typical histogram obtained by flow cytometric analysis after immunolabeling for Ep-CAM of freshly isolated HFP cells. It shows that two distinct populations of Ep-CAM– positive cells are present in the HFP, an Ep-CAMlow (arrow) and an Ep-CAMhigh (arrowhead) population. This pattern, when compared to the in situ detection of Ep-CAM (A and C), suggests that Ep-CAMlow cells comprise ductal cells (C and D, arrows), whereas Ep-CAMhigh cells (C and D, arrowheads) correspond to developing islet cells, and clusters of undifferentiated epithelial cells. The white tracing in D represents the autofluorescence of cells incubated with a mouse IgG2a used as a control reference. The data are representative of nine independent immunostainings using five independent donors (18–20 wk of gestation). Triple immunofluorescent localization was also performed on sections of human adult pancreas to simultaneously identify Ep-CAM, insulin, and glucagon. In this set of experiments, the brightest Ep-CAM– specific immunofluorescence was recorded at the cell–cell boundaries of intercalar ductal cells (E, arrowheads), in interlobular ducts (J), and in main ducts (G). Islets of Langerhans, identified by the insulin- (H) and glucagon-specific fluorescence (F), exhibit a significantly less intense Ep-CAM–specific fluorescence (E). Combined fluorophore spectra (I). The data are representative of four independent experiments, using three independent adult donors (20–56 yr old). Bars: (B) 30 μm; (H and G) 50 μm; (J) 40 μm.