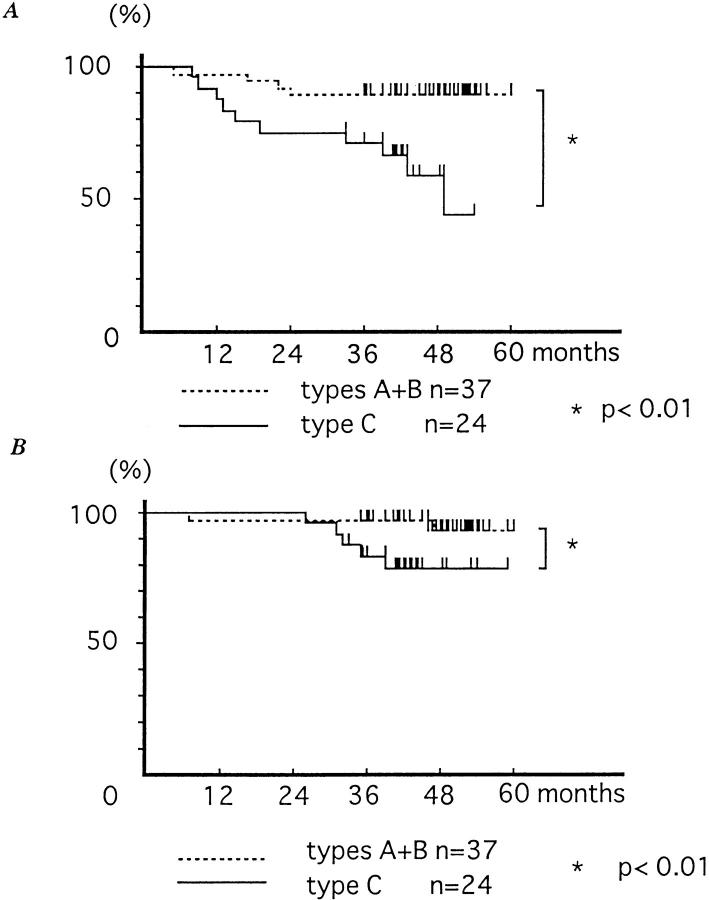
Figure 12.
(A) Disease-free survival curves of 61 patients with clinical stages I and II breast cancer, according to the subcellular localization of actinin-4. Disease-free survival curves are drawn using the Kaplan-Meiler method. Significant difference in disease-free survival is observed between types A + B (nuclear) and type C (nonnuclear) (P < 0.01). (B) Overall survival curves of 61 patients with clinical stages I and II breast cancer, according to the subcellular localization of actinin-4. Significant difference in overall survival is observed between types A + B (nuclear) and type C (nonnuclear) (P < 0.01).

