
Figure 3.
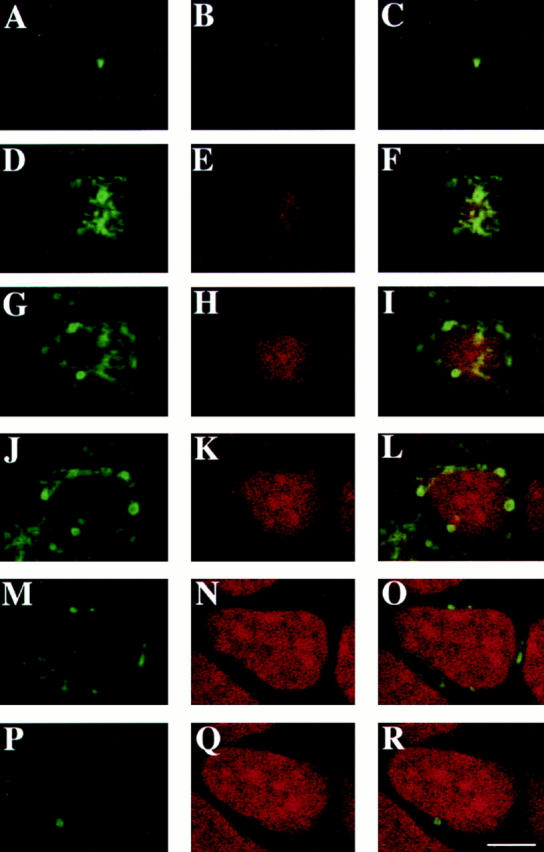

Localization of rab17 WT protein in polarized Eph4 cells. Eph4 cells were grown on filter supports, rab17 WT was induced with interferon, and cells were fixed and processed for confocal analysis. Cells were fixed, permeabilized, and rab17 was visualized using a polyclonal rabbit antibody followed by FITC-labeled donkey anti–rabbit IgG (A, D, G, J, M, and P). Nuclei were visualized with propidium iodide (B, E, H, K, N, and Q). C, F, I, L, O, and R represent the overlays. Samples were analyzed by serial sectioning from the apical cell surface (ACS; A–C) and the following sections are shown: 1.6 μm below the ACS (D–F), 2.4 μm below the ACS (G–I), 3.2 μm below the ACS (J–L), 5.6 μm below the ACS (M–O), and 8.4 μm below the ACS (P–R). Bar, 5 μm.