
Figure 10.
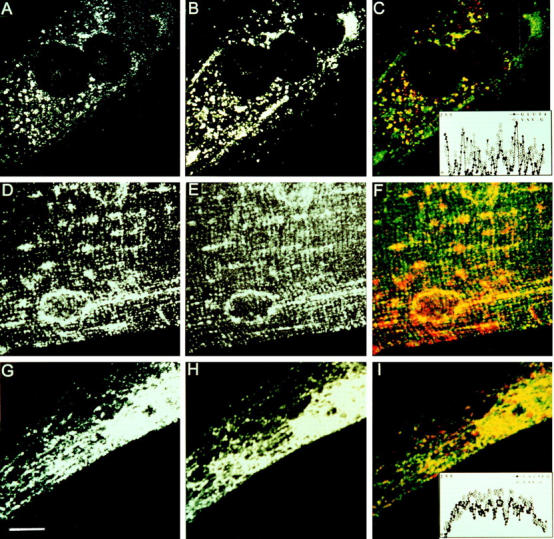
The G protein shows partial colocalization with the regulatable glucose transporter and calsequestrin in muscle cells. (A–C) L6 myotubes were infected with the VSV tsO45 mutant, incubated for 5 h at 39°C, and then followed by a 2-h incubation at 32°C in the presence of 0.4 mM cycloheximide. After permeabilization, double immunofluorescence staining for the regulatable glucose transporter and VSV G protein was performed using polyclonal antibodies for the glucose transporter and P5D4 monoclonal anti–G protein antibody. The glucose transporter was visualized by TRITC-conjugated anti–rabbit IgG (A) and the G protein with FITC-conjugated anti– mouse IgG (B). The color print (C) shows the glucose transporter (red), G protein (green), and colocalization (yellow). The inset is a graphical presentation of a line profile analysis of the fluorescence intensities (y-axis) of the corresponding pixels of glucose transporter (GLUT4) and VSV G protein staining on the x-axis. Arrowheads indicate points of VSV G signal without GLUT4 signal. (D–F) Double labeling for glucose transporter (D) and VSV G protein (E) in an isolated myofiber. Myofibers were infected for 10 h with wtVSV and then followed by a 1-h treatment with cycloheximide (0.4 mM) before fixation. In the color print (F), glucose transporter appears red whereas VSV G protein appears green; yellow indicates colocalization of the two markers. (G–I) Primary myotube culture was infected with recSFV–VSV G particles for 16 h. After 1 h of cycloheximide treatment, cells were fixed, permeabilized, and then subjected to double immunofluorescence staining for calsequestrin and G protein. Calsequestrin was visualized with Texas red–conjugated anti–mouse IgG (G), and then the G protein was visualized using FITC-conjugated anti–rabbit IgG (H). In the color print (I), calsequestrin appears red and G protein appears green; yellow indicates colocalization. The inset in I shows a line profile analysis for calsequestrin and VSV G protein. Matrox Inspector software was used to increase the contrast of the images shown in A–C and G–I. Confocal planes are shown. Bar, 10 μm.