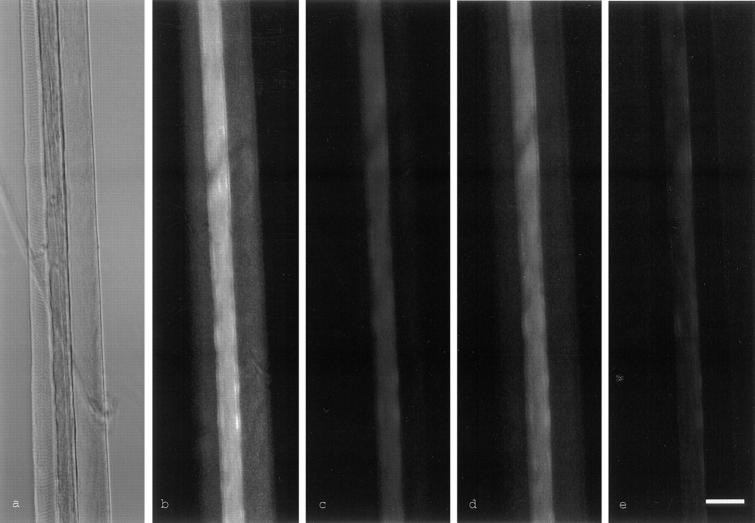
Figure 3.
Phase contrast and video-autofluorescence ratio images (flavoprotein/ NAD[P]H) of three saponin-permeabilized mouse quadriceps muscle fibers. Digital video images of NAD(P)H and flavoprotein autofluorescences were obtained with an Olympus IX-70 microscope equipped with a Kappa CF 8/1 DXC charge-coupled device camera using 366-nm (NAD[P]H, NU filter) and 470-nm (flavoprotein, NIBA filter) excitation, respectively. To visualize metabolic effects on the mitochondria, the flavoprotein image was divided by the NAD(P)H image. a, phase contrast; b, oxidized state; c, addition of 1 mM octanoylcarnitine and 5 mM malate; d, addition of 1 mM ADP; e, addition of 4 mM KCN and 10 mM glutamate. Bar, 50 μm.

