
Figure 7.
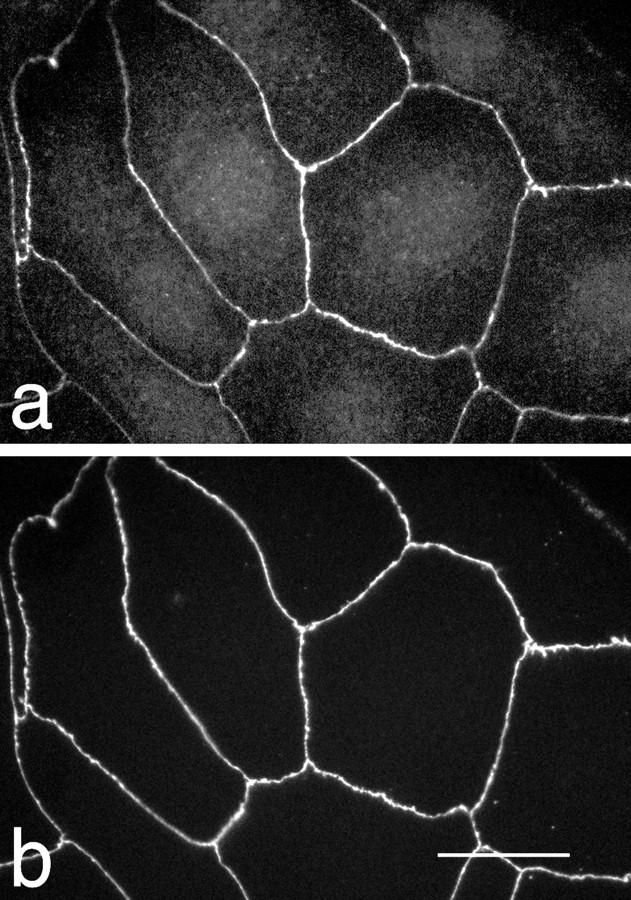
Immunofluorescent costaining of MDCK/Z3 cells for ZO-3 (a) and ZO-1 (b). ZO-3 and ZO-1 are identically distributed at cell borders. Additional staining of the cell cytoplasm is visible for ZO-3. Bar, 5 μm.
Official websites use .gov
A
.gov website belongs to an official
government organization in the United States.
Secure .gov websites use HTTPS
A lock (
) or https:// means you've safely
connected to the .gov website. Share sensitive
information only on official, secure websites.
Immunofluorescent costaining of MDCK/Z3 cells for ZO-3 (a) and ZO-1 (b). ZO-3 and ZO-1 are identically distributed at cell borders. Additional staining of the cell cytoplasm is visible for ZO-3. Bar, 5 μm.