
Figure 3.

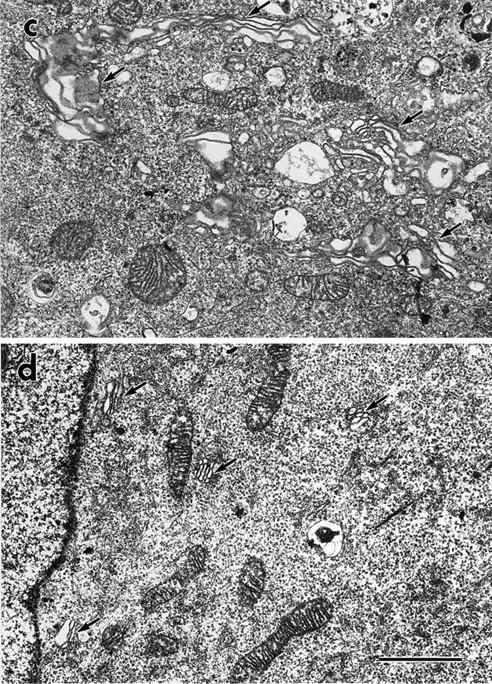

The Golgi complex was fragmented and dispersed throughout the cytoplasm of cDHC−/− cells. Control (a) and cDHC−/− (b) cells were stained with anti-GM130 antisera. Electron micrographs compare representative areas of the trophoectodermal cells of (c) control and (d and e) cDHC−/− cells. Arrows indicate the Golgi complex. (e) At higher magnification, the Golgi fragments (arrows) clearly consisted of stacks of several small flattened cisternae and associated with microtubules (arrowheads) in cDHC−/− cells. Bars: (a and b) 10 μm; (c and d) 2 μm; (e) 500 nm.