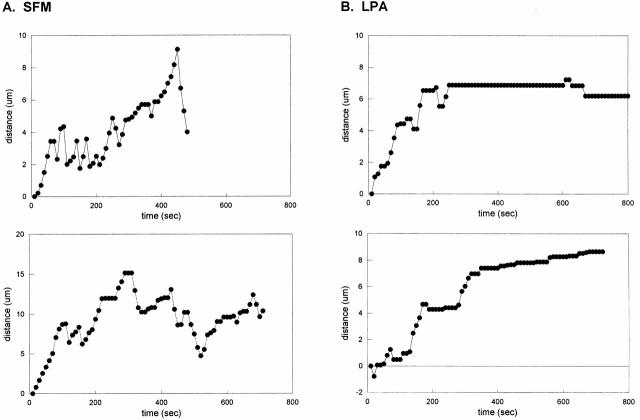
Figure 8.
Life history plots of MTs in SFM-treated cells and LPA-treated cells. Representative life history plots for typical MTs in control SFM-treated cells (a) and for long-paused MTs in LPA-treated cells (b). Data points indicate the change in position of the end of a single MT at 10-s intervals. MTs in SFM-treated cells undergo frequent transitions between growth and shortening phases, whereas long-paused MTs in LPA-treated cells do not grow or shrink for long periods of time.

