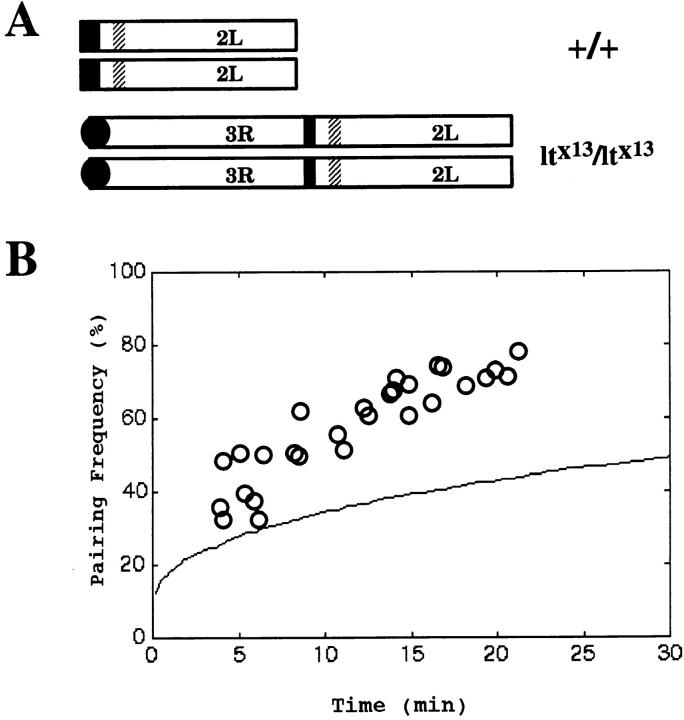
Figure 8.
Effects of chromosome rearrangement on the establishment of pairing. (A) Diagram illustrating chromosome arm 2L in a homozygous wild-type strain and in a homozygous lt×13 strain where 2L is translocated to the end of 3R. The dark filled areas indicate heterochromatic regions. The cross-hatched areas indicate approximate location of the histone locus. (B) Plot of the simulated pairing frequency for the histone locus in a lt×13 strain as a function of elapsed time in cycle 14. The experimentally determined pairing frequency for the histone locus in wild-type strain from Fig. 5 is plotted as empty circles. Plots were generated using actual experimental data for the initial distribution of the histone locus. D = 1.0 × 10⁻¹¹ cm2/s was used for the diffusion coefficient. Note that the pairing frequency is predicted to be much lower in the lt×13 strain than in the wild type (compare with Fig. 6 B, D = 1.0 × 10⁻¹¹ cm2/s).

