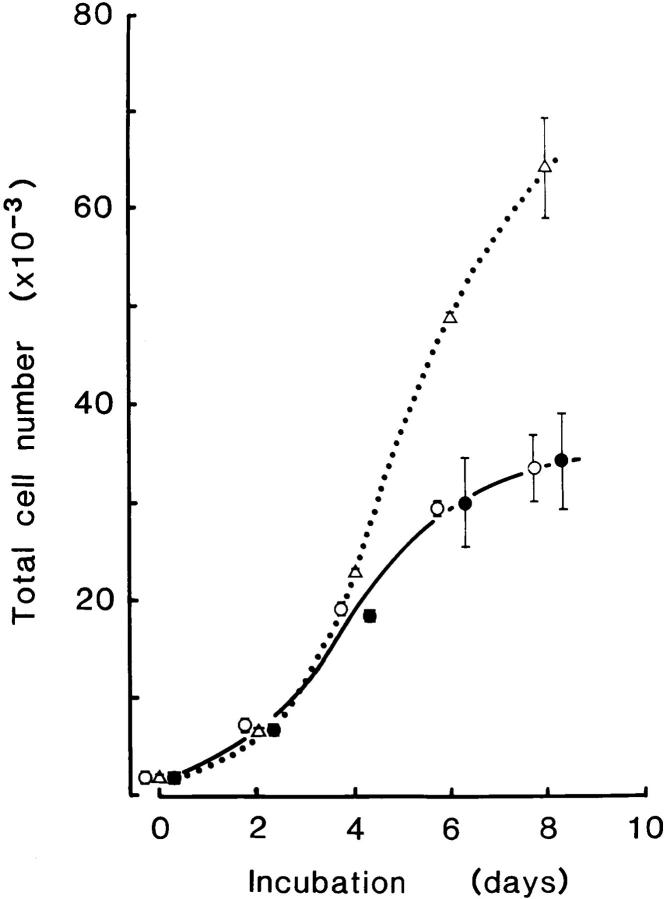
Figure 2.
Growth curves of P-12 and S-12 cells. P-12 (•) and S-12 (○) cells were plated at 0.7 × 10³ cells per well and cultured in gpt medium. S-12 cells were likewise plated and cultured in Dex medium (▵). The total cell number per well was determined every 2 d thereafter. Data represent the mean ± SD of duplicate or triplicate wells. Culture medium was removed on day 4, and detached cells collected, resuspended in fresh medium, and then transferred to the original well for continuation of culture. Values observed for P-12 and S-12 cells cultured in gpt medium were very similar at a given time point, and these values are plotted to the right and left sides of the appropriate time point. The growth curve of P-12 cells cultured in Dex medium (not shown) was almost identical to that of P-12 cells cultured in gpt medium.

