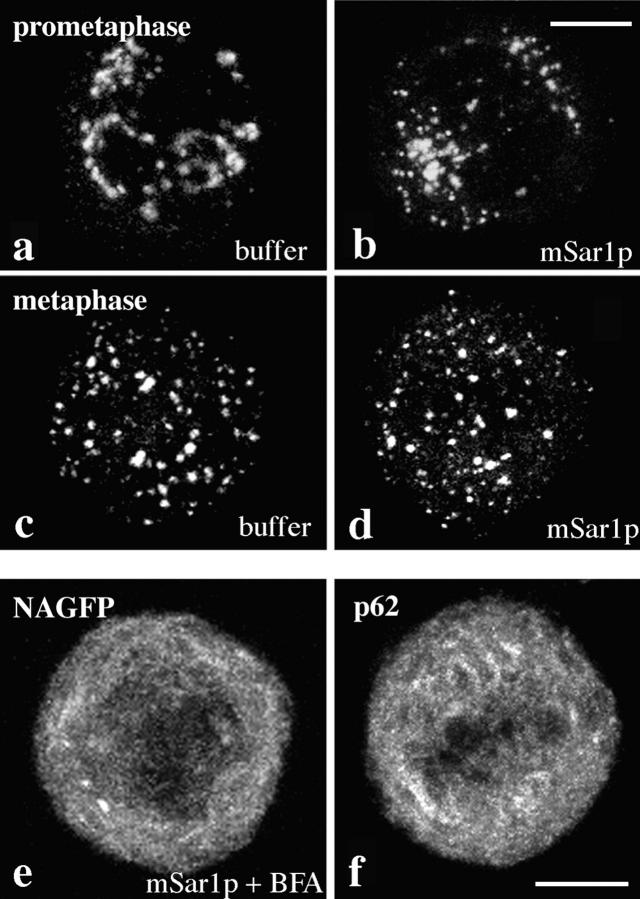
Figure 2.
Analysis of mitotic Golgi fragmentation in mSar1p injected cells. HeLa cells stably expressing NAGFP were enriched in late G2, and cells that had visibly not entered mitosis were microinjected with mSar1p and cascade blue conjugated BSA (b and d) or with cascade blue conjugated BSA only (a and c). 1 h after injection cells were fixed and mitotic cells analyzed by confocal microscopy. Projections of 10–25 z-sections (0.5-μm steps) ranging from the bottom to the top of the cells are shown. In e, cells were treated with 2 μg/ml BFA at the time of injection; in f staining for p62, an ER membrane protein is shown. Bar, 10 μm.

