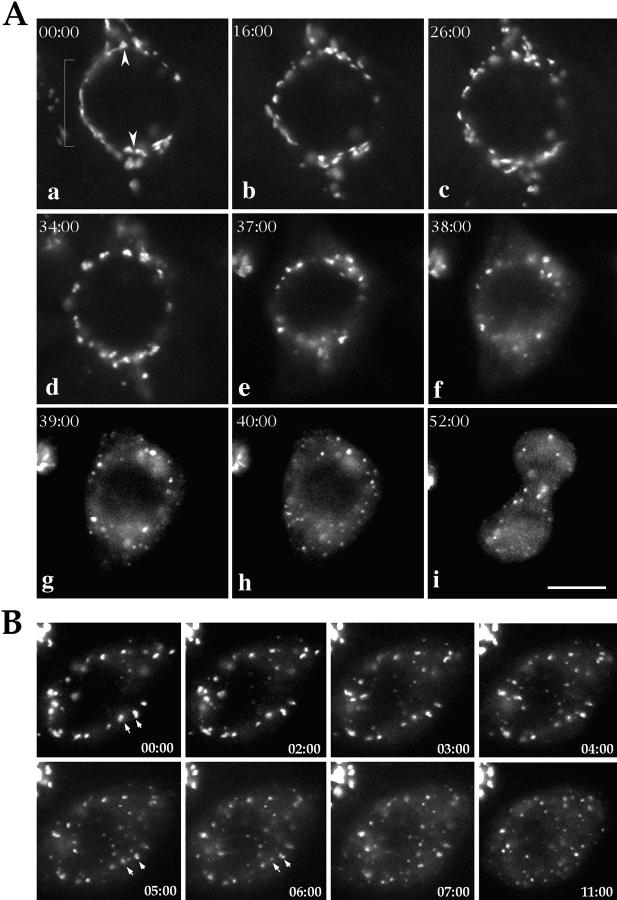
Figure 3.
Direct visualization of Golgi membranes during mitosis. (A) Images were acquired every 5 min to see changes in Golgi morphology indicating that cells were in late G2 or the beginning of prophase. Thereafter images were acquired every minute, and cells were followed through all phases of mitosis. Images in a–d show early prophase cells before the breakdown of the nuclear envelope. In e–h the prophase to metaphase transition is shown, and i shows the same cell in telophase. Arrows in a point to Golgi fragments organized around the position of the emerging spindle poles. (B) A series of images (1 min interval) acquired at the prophase to metaphase transition are shown. 02:00 marks the beginning of the second stage of fragmentation and a period of extensive Golgi scattering. Mitotic Golgi fragments are designated by arrows. A quicktime movie comprising the images acquired will be available on the internet. Bar, 15 μm.

