Figure 6.
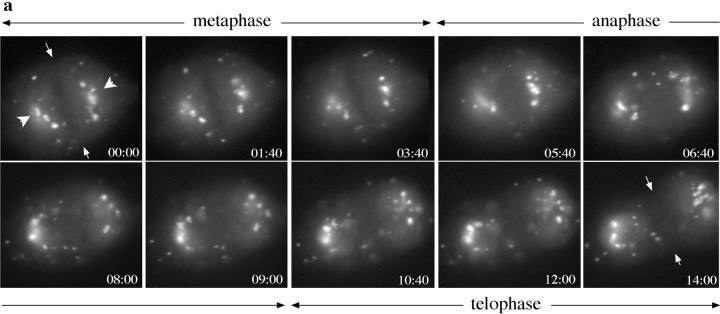
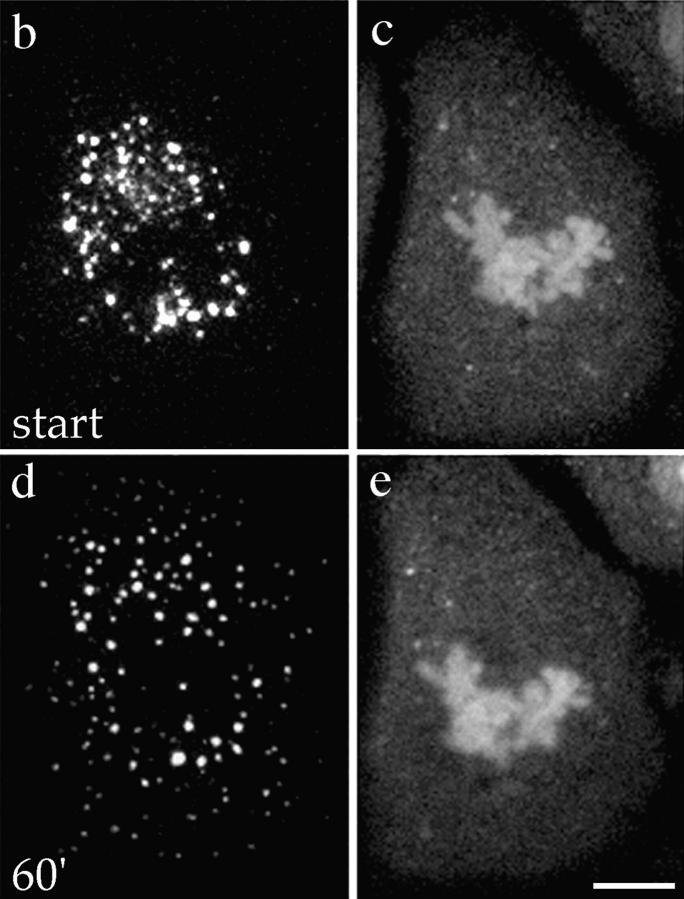
Organization of mitotic Golgi membranes by microtubules in living PtK1 cells. (a) A series of images acquired during the metaphase-to-telophase progression in a PtK1 cell line stably expressing the NAGFP chimera. Images were taken at 20-s intervals. Still images highlight the concentration of mitotic Golgi (arrowheads) on either side of the metaphase plate (arrows in first panel), presumably in association with elements of the mitotic spindle. This peri-spindle distribution of mitotic Golgi was maintained while Golgi membranes were partitioned into the daughter cells. A quicktime movie comprising the images acquired will be available on the internet. (b–e) A living prometaphase cell stably expressing NAGFP (b and d) was stained with dihydroethidium (c and e) to label DNA as described in Materials and Methods, and visualized using confocal microscopy. 10 z-sections through the entire depth of the cell were taken either before or at different time-points (shown is 60 min) after the addition of nocodazole (10 μM) and cycloheximide (100 μg/ml). Two-dimensional projections of the z-sections are shown. After disruption of the mitotic spindle with nocodazole, the peri-spindle organization of Golgi clusters redistributes (d), with mitotic Golgi appearing more frequently at the cell periphery. Bar, 10 μm.


