Figure 4.
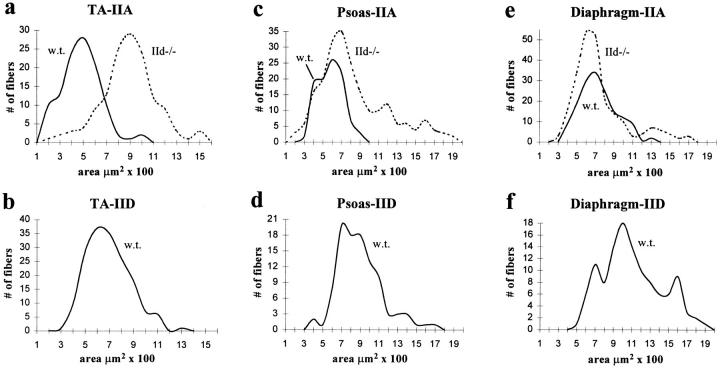
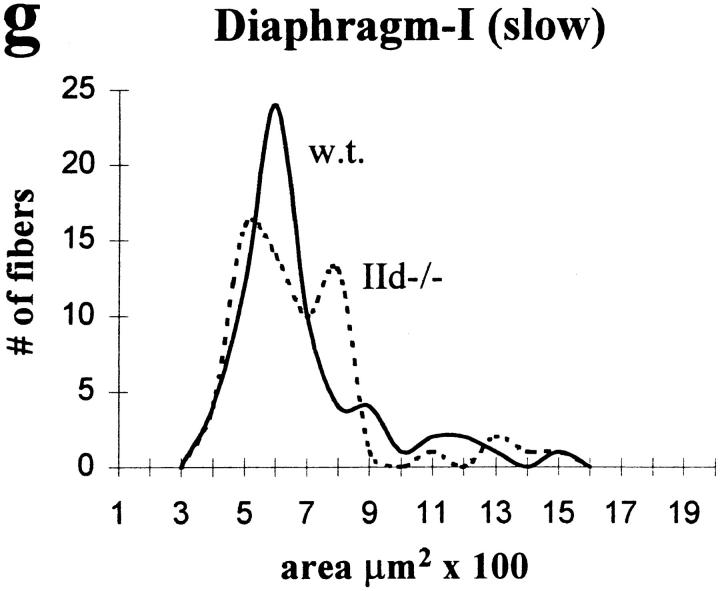
CSAs of type IIA, IID, and I (β, slow) fibers in skeletal muscles from MyHC-IId null mice. CSAs of type IIA fibers from wild-type and MyHC-IId null mice from TA (a), psoas (c), and diaphragm (e) are plotted as the number of fibers counted at each area. Wild type (w.t) are shown as solid lines; IId null (IId−/−) are shown as dotted lines. CSAs of type IID fibers from wild-type TA (b), psoas (d), and diaphragm (f) are also plotted as the number of fibers at each area. CSAs of type I (β, slow) fibers from diaphragms of wild-type (w.t., solid line) and IId null (IId−/−, dotted line) mice are shown in g. Sample numbers (n) are given in Table II.


