
Figure 8.
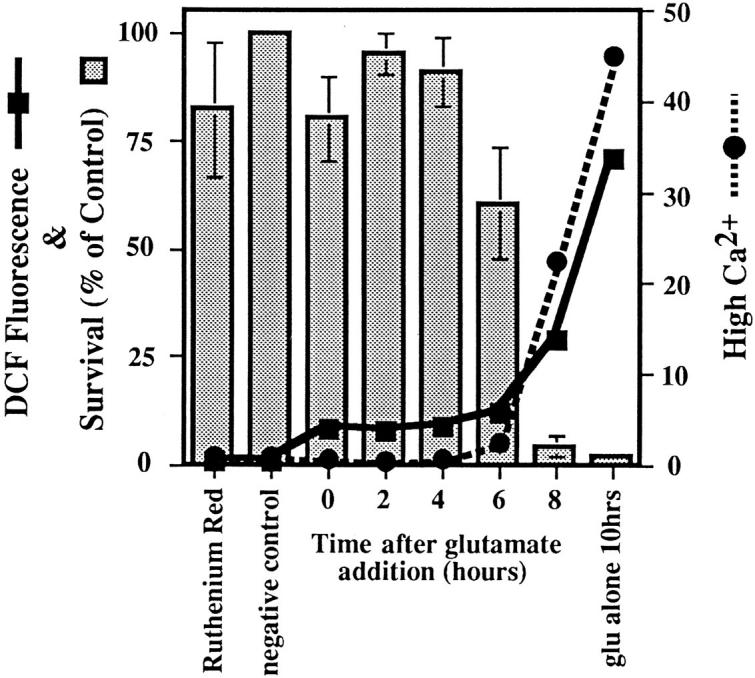
Intracellular Ca2+ cycling during glutamate exposure. Glutamate was added to all samples for 10 h, and 150 μM ruthenium red was added to the cells at 2-h intervals after the addition of glutamate. Ca2+ changes were detected as an increase in Indo-1 fluorescence over a wavelength designated as high, and data are presented as a ratiometric increase with respect to the control (black circles). ROS were detected using DCF and are expressed as the ratio of the median DCF fluorescence with respect to the control (black squares). Cell survival at 10 h is expressed as a percentage of the control (bars).