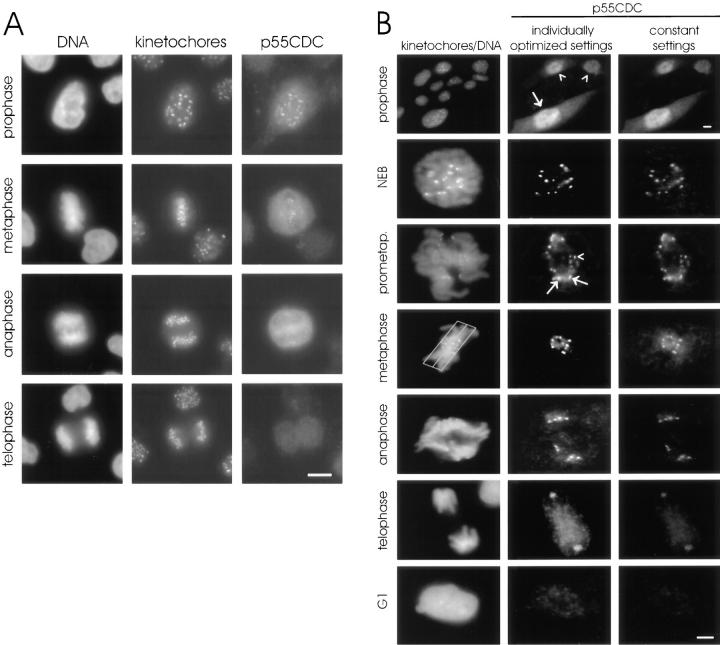
Figure 2.
Immunofluorescent localization of p55CDC in HeLa and PtK1 cells. (A) HeLa cells. The left column shows DNA (DAPI staining), the middle column shows kinetochores (human autoimmune antibody), and the right column shows p55CDC labeling. At prophase, diffuse labeling is seen throughout the cells with a concentration at the kinetochores. The kinetochore localization is apparent from late prophase to telophase. During anaphase, kinetochore labeling diminishes and is lost by the end of telophase. The diffuse cytoplasmic labeling persists until the M-to-G1 transition. (B) PtK1 cells. The left column shows DNA (Yo-Pro staining) and kinetochores (human autoimmune antibody). The middle column demonstrates p55CDC staining at different stages of mitosis where intensity and contrast settings have been optimized for each individual panel. This technique permits visualization of the staining at anaphase and telophase. The right column shows p55CDC labeling in which intensity and contrast settings were kept constant for all stages, allowing comparison of the relative intensity of labeling at different stages of mitosis. The top set of panels, taken at low magnification, shows a field of cells with some in G2 (arrowheads) and one in prophase (arrow). p55CDC relocalizes from the diffuse cytoplasmic/nuclear pool to the kinetochores of chromosomes just before NEB. Kinetochores show different intensities of labeling during prometaphase. At prometaphase, the kinetochores near the spindle poles often possess brighter signals (arrows) compared with ones that are closer to the spindle equator (arrowhead). The box (3 μm on either side of the spindle equator) used to define metaphase is shown. During anaphase, the anti-p55CDC signal gradually diminishes at the kinetochores, and ultimately disappears by late telophase. Bars, 5 μm.

