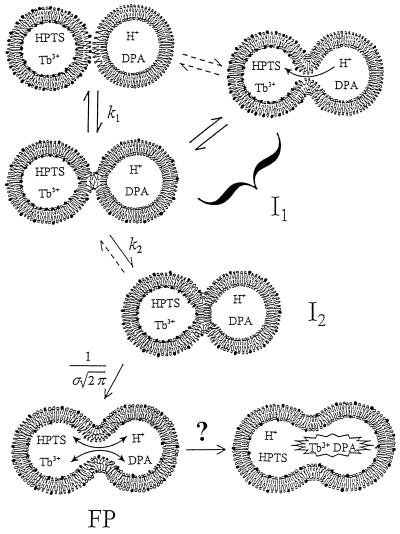
Figure 1.
Schematic diagram of proposed sequential steps leading to phospholipid vesicle fusion and biomembrane fusion. Outer monolayers brought to close contact by PEG are destabilized by high bilayer curvature induced by sonication. For protein-mediated biomembrane fusion, protein scaffolds may allow for close bilayer contact and protein conformational changes may provide local curvature stress (see Discussion). In the first step, a dynamic mixture of stalk (second down from left) and transient pore (top right) structures forms (I1) and accounts for outer-leaflet lipid transfer and transient proton transfer. This transient structure is presumed to account for the flickering pores seen by electrophysiological methods during the very early stages of both planar membrane and biomembrane fusion (see Discussion). The unstable intermediate I1 matures to the semi-stable intermediate I2 (third down from top left) that we show as a single bilayer septum separating the two aqueous compartments. This conversion accounts for the observed delay in both lipid transfer and proton transfer. Disintegration of the mature septum produces the FP (FP; bottom left) and allows complete lipid and proton transfer. Dilation of the FP (bottom right) has been discussed (but not unequivocally demonstrated) for biomembranes (37) and has not been demonstrated for model membranes. Phospholipid symbols with filled heads represent probe lipids that report lipid transfer during fusion. Dilution of probe lipids during inter-vesicle lipid transfer resulted in an increase in probe fluorescence lifetime (see Fig. 2). HPTS was used to measure proton transfer between two compartments at different pHs. Proton transfer was observed during both transient pore and FP formation, whereas mixing of larger molecules, Tb3+ and dipicolinic acid, was observed only during FP formation (6). Rate constants for the formation of intermediate I1, conversion to I2, and FP formation were defined as k1, k2, and 1/σ respectively (see Materials and Methods).

