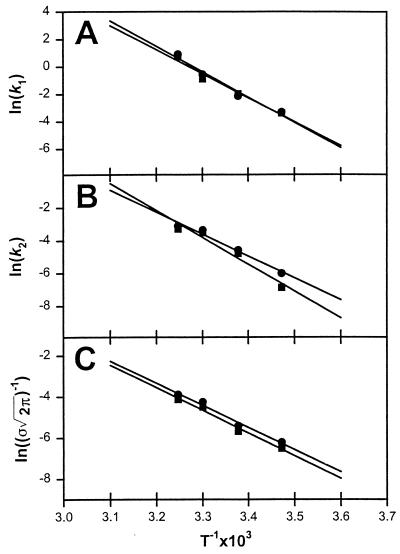
Figure 3.
Arrhenius plots for each of the three steps that we have identified as occurring during PEG-mediated vesicle fusion: (A) formation of I1, (B) conversion of I1 to I2, and (C) septum popping to form FP. Circles correspond to the rates obtained from lipid mixing data (LM) and squares correspond to the rates from proton transfer data (PT). The slopes determined the activation energies summarized in Table 1.

