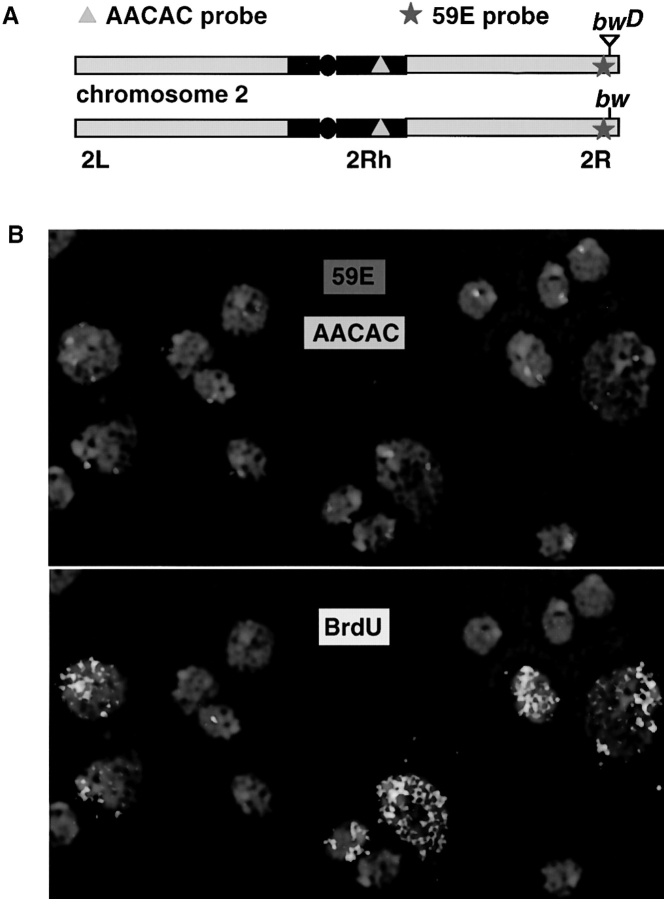
Figure 2.
Concurrent FISH and fluorescent BrdU detection to measure chromosome position. (A) Diagram of chromosome 2 from bwD and wild type with the locations of the genomic probes indicated. Black region is heterochromatic. The circle represents the centromere. (B) Two panels of interphase nuclei from the CNS of a bwD larva. DAPI staining is in blue. (Top) Hybridization of the two probes in A. (Bottom) The same nuclei with the signal from anti-BrdU fluorescein indicating those nuclei that have incorporated DNA within the last 4–5 h. Differential and weak DAPI staining (relative to anti-BrdU staining) are responsible for the seeming discordance of DNA localization, FISH signal and BrdU incorporation.

