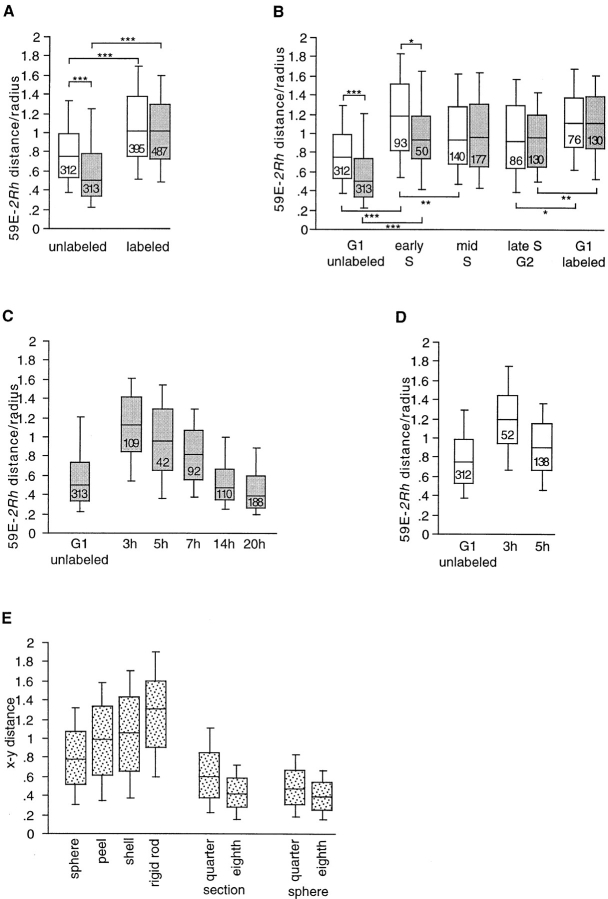
Figure 3.
Cell cycle–dependent chromosome movements. Box plots of the distance between the 2Rh probe (AACAC) and the 59E probe divided by the radius of the nucleus. Data from wild-type nuclei are shown in white boxes, and bwD nuclei are shown in gray boxes. Simulated distributions are shown in spotted boxes. The numbers in the boxes are the total number of measurements in each plot. The asterisks on the brackets indicated the level of significance for the bracketed pair as determined using the two-tailed Mann-Whitney U test for nonparametric comparison of two unpaired groups. *P < 0.05; **P < 0.01; ***P < 0.001. (A) Comparison of BrdU-labeled and -unlabeled nuclei. Data from the first three time points in Table I are pooled. (B) Same data as in A categorized by cell cycle stage based on DAPI intensity and BrdU labeling pattern as described in Materials and Methods. G1 labeled nuclei are those that are just postmitotic. (C) Box plots showing reassociation of bwD and 2Rh after mitosis. The first box plot is for the unlabeled bwD nuclei from B. The second and third boxes are for post mitotic nuclei (G1-labeled class) from data collected from larvae fed BrdU for 3.5 or 5 h, respectively. The last three boxes are for labeled nuclei from larvae that have been pulse-fed BrdU. The time from initial feeding is given on the x axis, so the hours that these nuclei are postmitotic is roughly this time minus 2–4 h. All of the data sets were significantly different from each other (at least P < 0.05), with the exception of the G1 unlabeled set and the 14-hr set. (D) Box plots showing loss of Rabl orientation after mitosis in wild-type nuclei. The first box plot is for the unlabeled wild-type nuclei from B. The second and third boxes are for postmitotic nuclei (G1-labeled class) from data collected using larvae fed BrdU for 3.5 or 5 h, respectively. All of the data sets were significantly different from each other (at least P < 0.05). (E) Box plots drawn from the simulated xy distances for the models indicated.

