Figure 5.
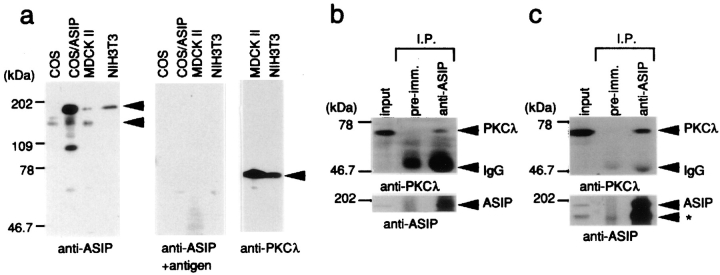
ASIP expression and association with aPKC in NIH3T3 and MDCKII cells. (a) Western blot analysis with anti-ASIP (C2) or anti-PKCλ (mAb) antibodies. Total extracts of the indicated cells were subjected to Western blot analysis. The central panel shows the results obtained using anti-ASIP (C2) antibody preabsorbed with antigen. Arrowheads show two specific ASIP bands (180 and 150 kD) (left) and a PKCλ band (right). (b and c) Association of ASIP and aPKC in NIH3T3 (b) and MDCKII (c) cells. Cell extracts were clarified by centrifugation (input) and immunoprecipitated with anti-ASIP (C2) antibody. The immunoprecipitates were probed with anti-PKCλ (mAb) antibody (top) or anti-ASIP (C2) antibody (bottom). Asterisk indicates the 150-kD ASIP band (c).

