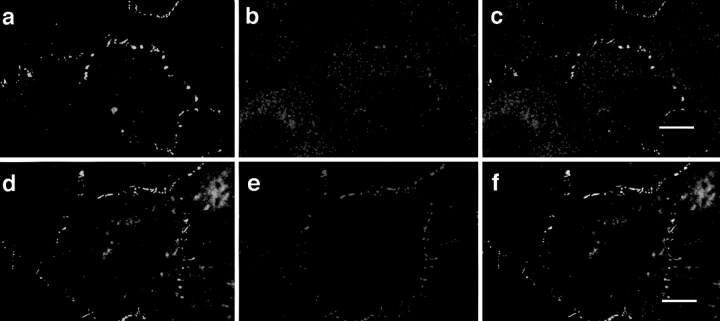
Figure 7.
Colocalization of ASIP with aPKC and ZO-1 at cell junctions in NIH3T3 cells. Confluent NIH3T3 cells were doubly stained with anti-ASIP (C2) antibody (a and d, green) and anti-PKCλ antibody (mAb) (b, red) or anti-ZO-1 (e, red) followed by FITC-conjugated anti-rabbit IgG and Cy3-conjugated anti-mouse IgG antibodies. The yellow and orange staining in c and f indicates the colocalization of ASIP and PKCλ or ZO-1. Bars (c and f), 10 μm.

