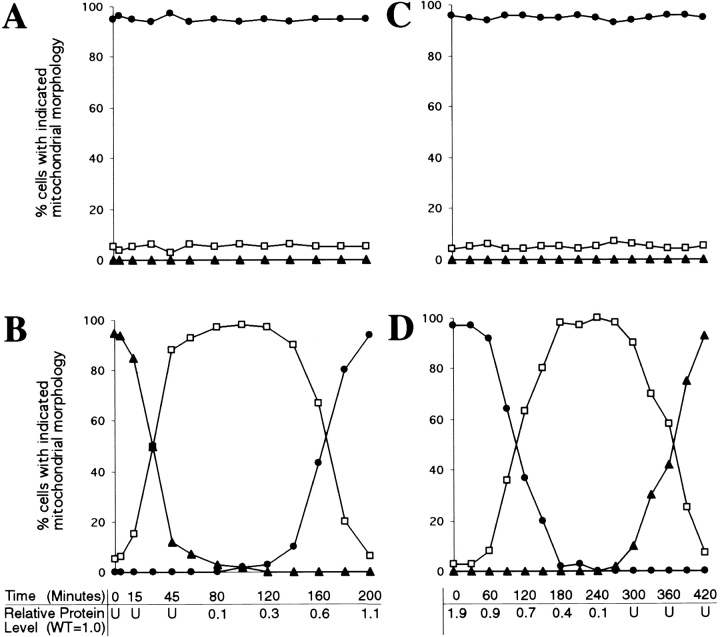
Figure 8.
Mitochondrial morphology changes in response to changes in DNM1 gene expression. Null (closed triangles), intermediate (open squares), and wild-type (closed circles) mitochondrial morphologies were quantified by DiOC6 staining in cells containing a single genomic copy of the wild-type DNM1 (JSY1238; A and C) or GAL1-DNM1 (JSY1678; B and D) gene. (A) DNM1 cells transferred from dextrose to galactose. (B) GAL1-DNM1 cells transferred from dextrose to galactose. (C) DNM1 cells transferred from galactose to dextrose. (D) GAL1-DNM1 cells transferred from galactose to dextrose. The amount of Dnm1p expressed in the GAL1-DNM1 strain relative to the DNM1 strain is indicated for selected time points below graphs B and D. (WT = DNM1 = 1.0; U, undetected). (E) Representative examples of Null (closed triangles), intermediate (open squares), and WT (DNM1; closed circles) mitochondrial morphologies. Buds are in the upper portion of each panel. Bar, 2 μm.


