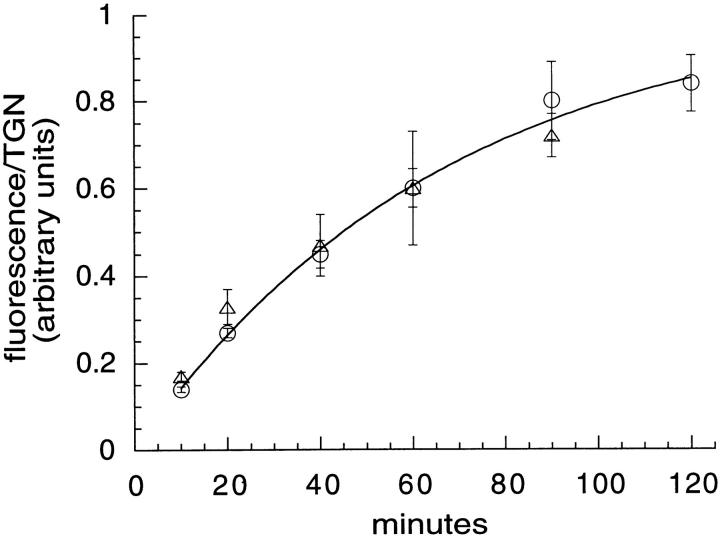
Figure 10.
Accumulation of TacTGN38 in the TGN. Cells were incubated with F-anti-Tac IgG for the times shown, fixed, and labeled with Cy3-anti-Tac IgG. Confocal microscopy was used to obtain the entire 3-D distribution through the cell, and these images were quantified to determine the amount of F-IgG per TGN volume element (○). The data were fit to a kinetic approach to steady state with a half-time of 46 min. Cells were also incubated with Cy3-anti-Tac Fab for different times, and then the TGN was stained with C6NBD-ceramide. Single slice images were obtained by confocal microscopy. Quantification of the amount of Cy3-Fab fluorescence per TGN area (see Fig. 9, c–f) also gave a half-time of 46 min (▵). Error bars represent SEM.

