Figure 10.
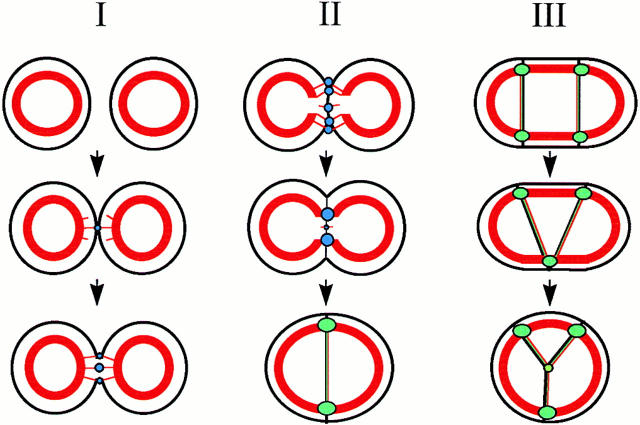
A three-stage model for cell–cell adhesion and colony formation. Stage I: multiple E-cadherin puncta form along the developing contact and loosly hold contacting cells together. A circumferential actin cable (thick red line) surrounds isolated cells. As cells adhere, E-cadherin clusters into puncta within the cell–cell contact interface (blue circle) and rapidly associates with thin actin bundles and filaments (thin red lines). As the contact lengthens, puncta continue to develop along the length of the contact at a constant average density during the first 2 h. Stage II: E-cadherin plaques develop at the edges of the contact which compact and strengthen cell–cell interactions. Stabilization of actin filaments by E-cadherin puncta within the cell–cell contact results in gradual dissolution of the circumferential actin cable behind the developing contact and insertion of the circumferential actin cables into the cell–cell contact accompanied by additional clustering of E-cadherin puncta into E-cadherin plaques (green ovals). Between cell plaques, E-cadherin is more diffusely distributed (green line) and associates with actin filaments oriented along the axis of the cell–cell contact (red line). Stage III: E-cadherin plaques cinch together to form multicellular vertices, further condensing cell colonies. In multicellular colonies, contractility within the circumferential actin cable brings E-cadherin plaques from adjacent cells together. Dynamics within the cytoskeleton result in continual rearrangement.

