
Figure 4.
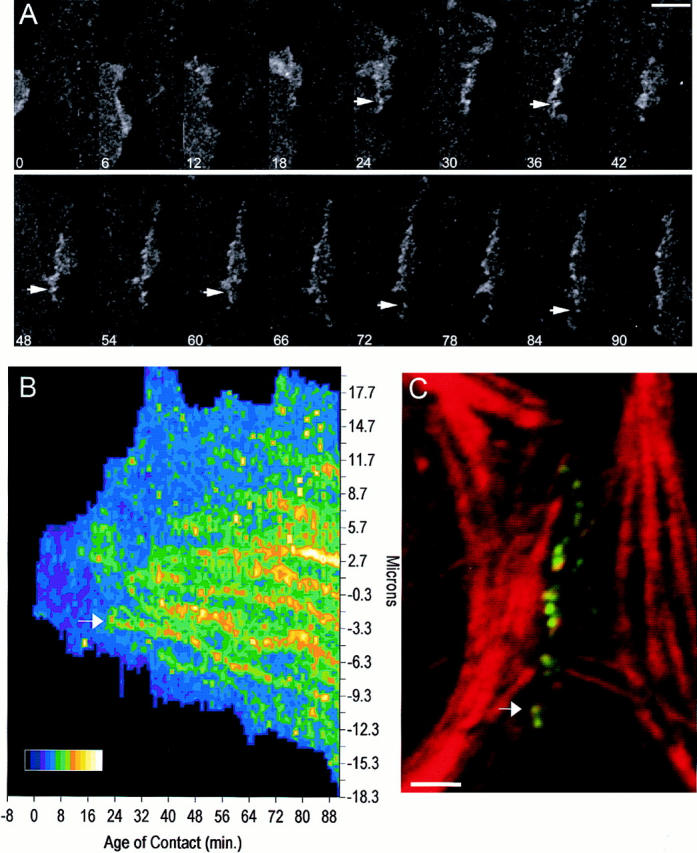
EcadGFP puncta are formed and stabilized along newly formed cell–cell contacts. (A) 16 time-lapse images of EcadGFP cells taken from a sequence recorded every 1 min for 100 min at 0.11 μm/pixel; time in min after formation of the contact is shown. Arrows follow a single punctum. (B) TIP scan of all of the time-lapse images from the experiment represented in A. The contact was divided into 129 0.22-μm sections, and the maximum fluorescence intensity at 100 time points was collected for a total of 12,900 data points. The contact originates at 0 min and 0 μm. Small fluctuations in the apparent intensity of stable puncta are near the limits of instrumental noise sources such as laser output fluctuations and noise processes in the photomultiplier tube detector. (C) Double immunofluorescence of the same contact extracted with Triton X-100, fixed with formaldehyde, and stained with rhodamine phalloidin and E-cadherin mAb 3G8/CY5. The arrows in all panels point to the same punctum. Bars: (A) 10 μm; (C) 5 μm. (B) 0–210 gray scale fluorescence intensity units divided into 15 colors.