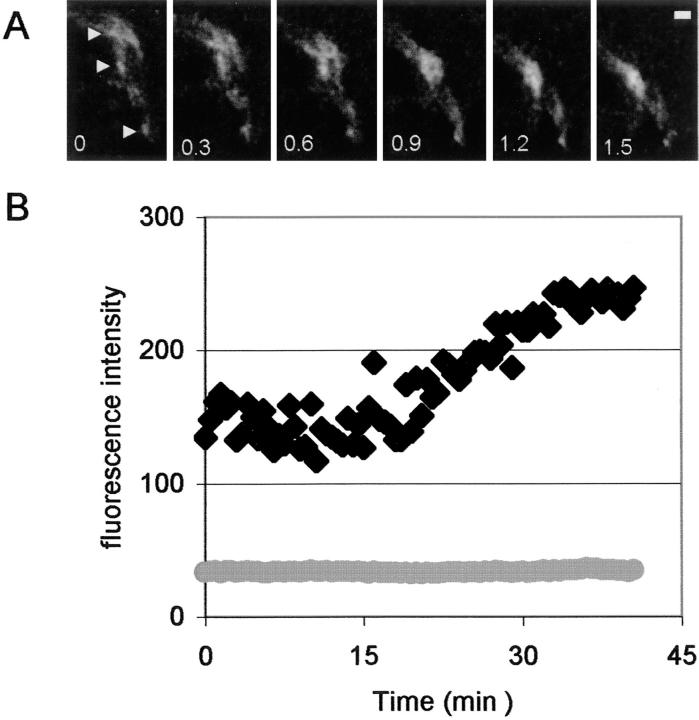
Figure 6.
EcadGFP puncta cluster into plaques during transition between early and late stages of adhesion. (A) Representative images of a time-lapse sequence taken at 0.8 Hz for 300 s at 0.12 μm/pixel in a region of the cell–cell contact in which a plaque is developing. Time is in min; arrows point to individual puncta; bar, 2 μm. (B) Quantitative fluorescence intensities of EcadGFP. The average (gray circles) and maximum (black diamonds) intensities in a 20-μm2 region surrounding a developing plaque area are plotted over a 40-min period. The average fluorescence intensity of the same number of EcadGFP in a fixed area is constant regardless of its distribution. However, the maximum fluorescence intensity increases as EcadGFP clusters into a smaller region within that fixed area. For details, see Materials and Methods.

