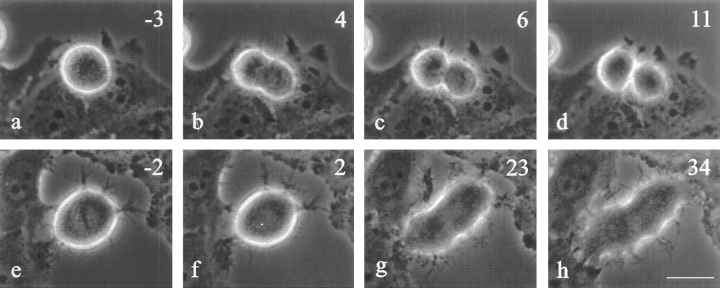
Figure 4.
Time lapse images of control (a–d) and C3- injected HeLa cells (e–h). Approximate time in minutes relative to anaphase onset is located in the upper right corner. Cells injected with C3 were not able to complete cytokinesis (h), although some did attempt a weak furrow that could not progress (g and h). Control cells injected with 10 mM Hepes, pH 7.5, had no difficulty completing division (c and d). Bar, 20 μm.

