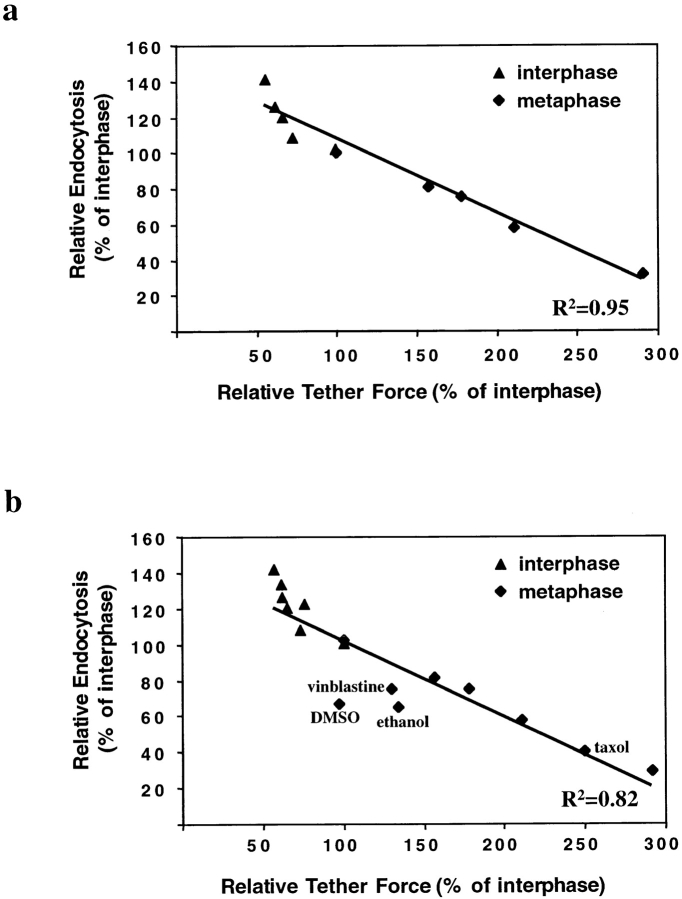
Figure 7.
Relative tether force and relative endocytosis rate in interphase and metaphase cells for: (a) different concentrations of deoxycholate; (b) different concentrations of deoxycholate, DMSO, ethanol, and cells arrested with taxol or vinblastine. Tether force and endocytosis rate are expressed as a percentage of the value of interphase cells. Line represents linear least square fit of the data points.

