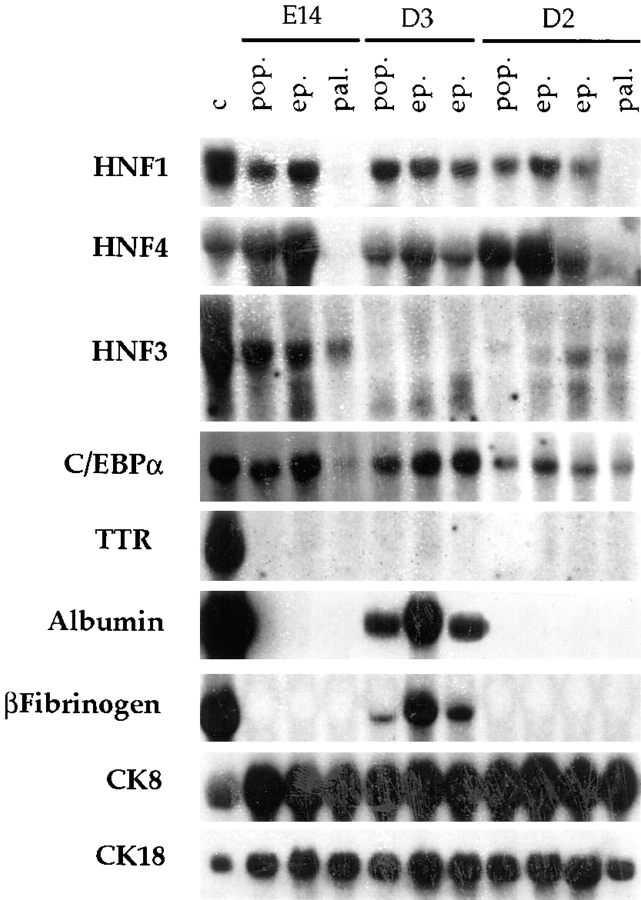
Figure 3.
Characterization of the profile of liver-specific gene expression in MMH lines and their clones. Northern blot analysis of total RNA from the E14, D2, and D3 parental populations (pop.), from the epithelial (ep.) and palmate (pal.) clones, and from the control Fao rat hepatoma line (c). Each lane was loaded with 20 μg of total RNA. Probes used are indicated on the left.

