Figure 3.
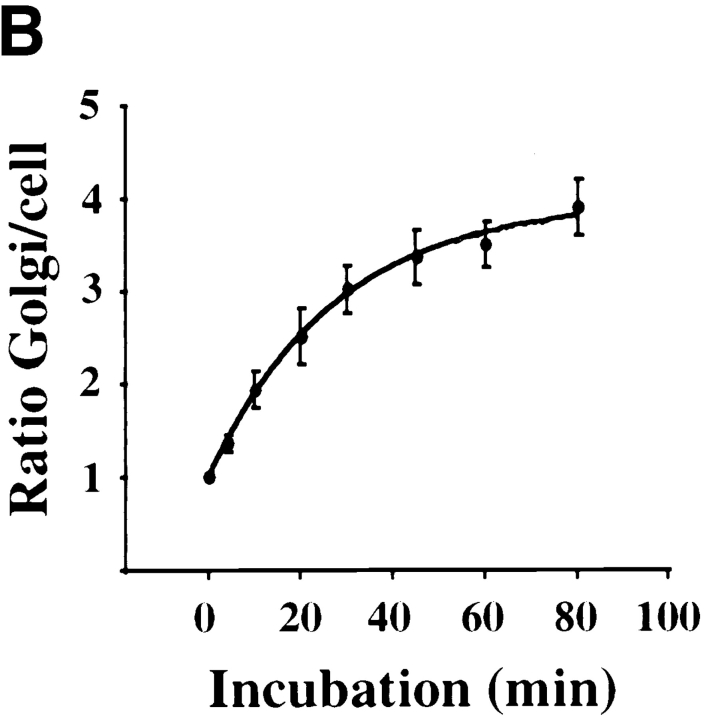
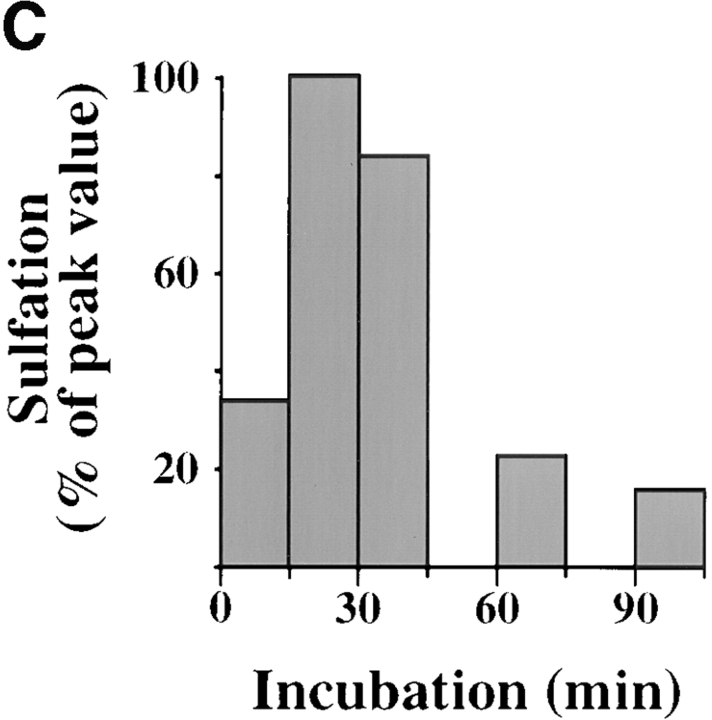
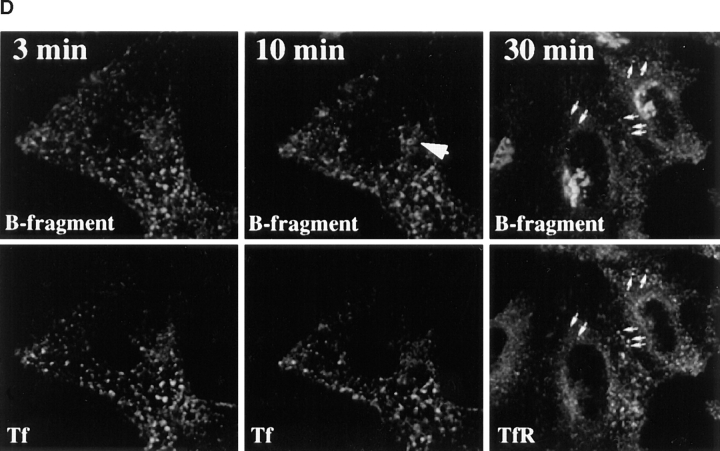
Kinetics of B-fragment transport from EE/RE to the Golgi apparatus. (A) Confocal microscopy on living HeLa cells. Fluorophore-labeled B-fragment was internalized for 1 h into HeLa cells at 19.5°C, upon which the cells were transferred to the stage of a confocal microscope and incubated at 37°C. Digital images (four integration frames) were acquired at the indicated time points. Note that after 4 min, B-fragment was detected in peripheral structures, and then later concentrated in the perinuclear region. (B) Images as shown in A were quantified, and the fraction of average Golgi associated fluorescence over average total cell-associated fluorescence is represented in function of incubation time at 37°C. The means (± SE) of eight experiments are shown. The curve was fitted to f(x) = 1 + 2.97[1 − exp(−0.036×)], r = 0.9979. (C) Sulfation analysis. B-(Sulf)2 was internalized into HeLa cells at 19.5°C, and the cells were then shifted to 37°C. After 0, 15, 30, 60, and 90 min, radioactive sulfate was added for 15 min. Note that B-(Sulf)2 is at its peak concentration in the TGN during the 15–30 min interval. A representative of 2 experiments is shown. In each experiment, the data points were obtained in duplicate. (D) Cotransport of B-fragment and Tf in living cells. For the points 3 and 10 min at 37°C, fluorophore-coupled B-fragment and fluorophore-coupled Tf were internalized as described in A. For the point 30 min at 37°C, B-fragment alone was internalized continuously at 37°C, cells were then fixed and stained for the TfR. Note that the B-fragment concentrated in the Golgi area (large arrow at 10 min), while remaining cytoplasmic B-fragment–containing structures always were Tf (4 and 10 min) or TfR (30 min) positive (small arrows at 30 min). Single optical slices were obtained by confocal microscopy.


