
Figure 1.

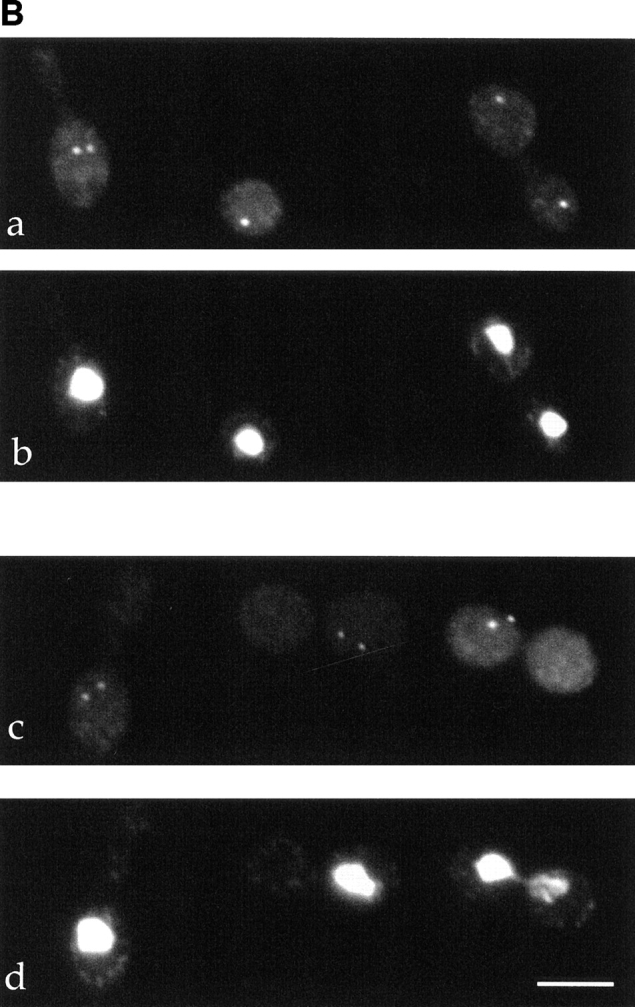

DUO1 overexpression phenotypes. (A) a–c are phase micrographs, d–f are fluorescence micrographs showing microtubule staining, and g–i are fluorescence micrographs showing DNA (DAPI) staining. The first column shows wild-type cells (a, d, and g), the second column shows cells after 8 h of DUO1 overexpression (b, e, and h), and the third column shows cells after 16 h of overexpression (c, f, and i). For overexpression studies, cells were grown in glucose medium until log phase, washed, and grown in raffinose medium for 12 h, and then galactose was added to the raffinose-containing medium. (B) The effect of DUO1 overexpression on spindle pole bodies. a and c show Tub4p staining, and b and d show nuclear (DAPI) staining. a and b show wild-type cells, and c and d show cells overexpressing DUO1 for 16 h. (C) FACS® analysis of nuclear DNA. a shows FACS® data for a wild-type control strain. b shows FACS® data before DUO1 overexpression. c shows FACS® data for the same cell line in b 8 h after overexpression of DUO1 was initiated. Bars, 5 μm.