
Figure 5.
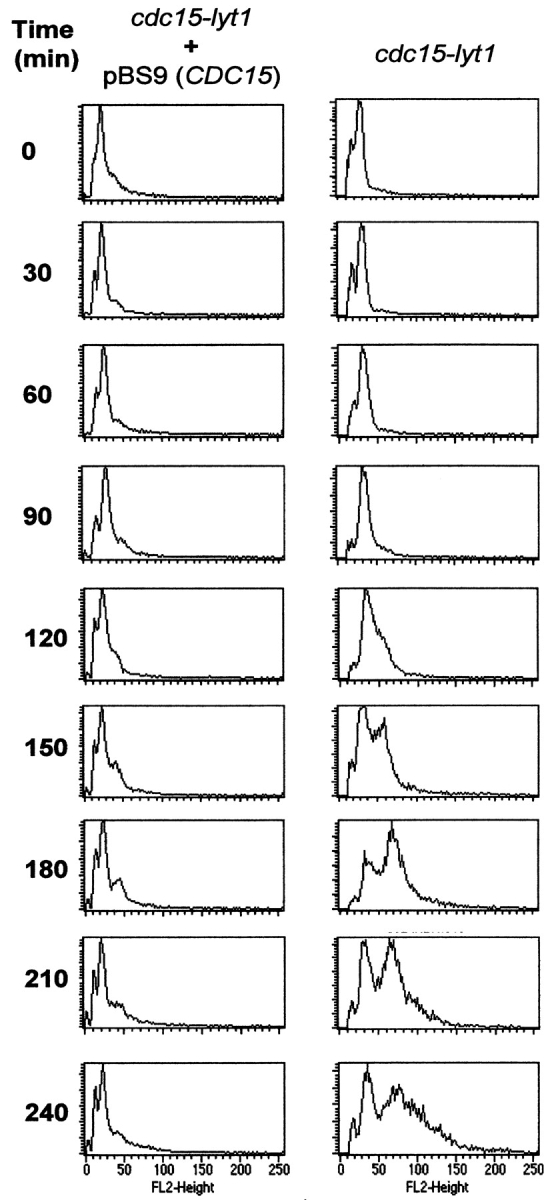
Flow cytometry graphics of RNase-treated propidium iodide-stained cells of the L2C24d strain. Cells were incubated at 37°C in osmotically stabilized media and samples were taken every 30 min. Peaks correspond to cell populations containing different amounts of DNA. The peak corresponding to a DNA content of 1 nucleus per cell (G1 peak) appears at ∼15 fluorescence units (see scale at the bottom), the G2/M peak (2 nuclei per unit) stands at ∼30 units, and cells displaying a DNA content equivalent to 4 nuclei appear at 60 U. Upon expression of the cdc15 phenotype (right), the G1 peak progressively disappears due to the accumulation of cells in anaphase. After 150 min, a new well-defined peak reveals a new population of cells with a larger amount of DNA. None of these phenomena occurred when the same strain was transformed with a CDC15-containing plasmid (left).