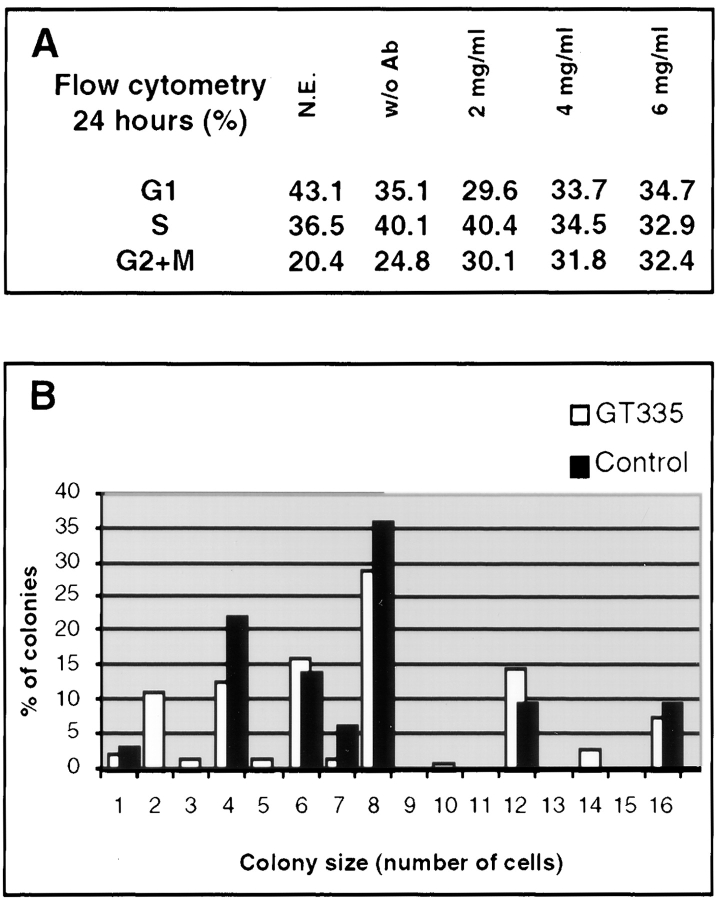
Figure 12.
Growth of GT335 mAb–loaded cells. (A) Flow cytometry analysis of cell cycles show an increase in G2/M phases for GT335 mAb–loaded cells after 24 h. N.E., nonelectropermeabilized cells; w/o Ab, cells electropermeabilized without antibody; 2–6 mg/ml, final antibody concentration for cell electropermeabilization. (B) Cells were plated at low density after loading with GT335 mAb, and the number of cells per colony was determined 5 d later. Bars represent the percent of colonies in the corresponding size. For each colony size, the first bar (white) is for GT335 IgGs, and the second bar (black) is for control IgGs. The distribution of the colonies according to their size did not appear significantly different.

