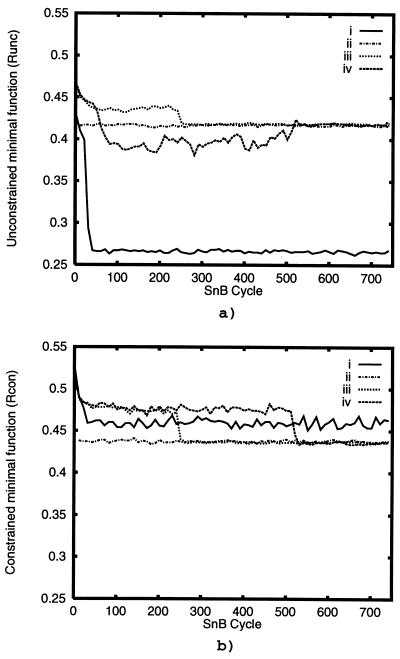
Figure 1.
Plots of the unconstrained (Runc) (a) and the constrained (Rcon) (b) minimal function vs. SnB cycle. i, trials with default parameters that resulted in a uranium map; ii, a stability test with the known atomic positions as the starting peaks; iii, a correct solution where Runc and Rcon exhibit similar behavior; and iv, a correct solution where Runc and Rcon exhibit different behavior.

